Survey Information
Sampling Procedure
- A working group has determined the process which needs to be followed to ensure that the crop quality samples which are sent to the SAGL are representative of the total crop.
We would kindly like to request you to ensure that in future the following procedure is followed when submitting your crop quality samples to the SAGL.
- Each delivery should be sampled as per the grading regulations for grading purposes.
- After grading, the grading samples need to be placed in separate containers according to grade.
- After 80% of the expected harvest has been received, the silo should divide the content of each container with a multi slot divider in order to obtain a 3kg sample. (This should be done for each grade separately).
- If there’s more than one container per grade, the combined contents of the containers should be mixed thoroughly before dividing it with a multi slot divider to obtain the required 3kg sample.
- These samples need to be sent to the SAGL as soon as possible.
- Please mark the samples clearly with the Name of the Silo, bin number(s) represented by each individual sample and grade.
- Please package the samples in strong plastic bags and sturdy cardboard boxes and deliver or send the samples by means of a courier to:
SAGL
Grain Building
477 Witherite Road
The Willows
Pretoria
0040
- Please use the following courier service for the sending of the samples:
Dawn Wing, Acc. No. PRY2317, Budget option, Tel. 012 423 8800
OR
E-mail collection request to DLS Worldwide (Pty) Ltd
Contact: Justine Mathe / Elaine Hayward
E-mail: justine@dyls.co.za / elaine@dyls.co.za
-
Only one sample per grade per silo has to be sent to the SAGL.
Your cooperation is much appreciated.
Activity List
SAGL activity list for the wheat crop quality report:
- Upon commencement of the harvesting season, SAGL sends out circulars to all members of the Grain Silo Industry as well as to the National Chamber of Milling as a reminder for the sending of representative crop samples to SAGL. Included in the circular is a sampling procedure as well as courier information for the sending of samples to SAGL. (Please see the procedure for sampling and sending of samples to SAGL below.)
- SAGL starts receiving samples within a month of sending out the circulars.
- Analysis commences upon receival of the first samples.
- Within two weeks of receiving the first samples, the first data are available on the SAGL web site.
- Results are from then on updated onto the web site on a weekly basis.
- The suppliers of the samples, receive the results on a weekly basis via e-mail.
- The sending of samples to SAGL is followed up by means of weekly telephone calls.
- Analyses:
- Each of the 480 samples, representing the different production regions, is fully graded and thousand kernel mass is done.
- Small sub-samples are milled on the Quadromat mill, after which moisture and protein analyses followed by a Mixograph analysis are done. These analyses take 2 – 3 months to complete depending on the availability of samples.
- When all the samples from a specific production region have been received and graded, composite samples per class and grade per region can be made up. For the Northern production regions this normally happens at the earliest towards the middle of March.
- Once the composite samples are made up, they are milled on the Bühler mill, moisture, protein and colour analyses are done and then Rheological tests (Farinograph, Alveograph, Extensigraph, Mixograph and 100-gram baking tests) are performed. These analyses take between one and one and a half months time to complete as this is done in the same time frame as the annual wheat breeder line evaluations.
- In the meantime cultivar identification is done on each of the samples and sale figures of seed sold by the commercial grain silo owners are obtained.
- Mycotoxin analyses, comprising of Aflatoxin, Deoxynivalenol and Ochratoxin A analyses are done on 30 randomly selected samples.
- When all the analyses have been completed, normally at the beginning to the middle of May, SAGL starts with the compiling of the report, this includes drawing up of tables and graphs, statistical analysis of data an the most time consuming part, the selection of graphs representing the different production regions. The compiling and formatting of the report as well as the reduction of the graphs normally takes three to four weeks. The final draft of the report is forwarded to the printers approximately a week before the hard copy report is ready for distribution.
- As the planting and harvesting times are highly dependant on environmental and climatic conditions, setting fixed dates for the individual activities is not an option.
- The whole process of putting together a crop report is very time consuming. SAGL personnel work at full capacity in order to make the report available as soon as possible.
- The sooner the samples are forwarded to and received at SAGL, the sooner analyses can commence and the sooner the report can be made available.
Time Line
Wheat crop quality report time line:
Planting season: |
Second half of April – middle of June (Southern production areas) |
|
July – August |
Harvesting season: |
October – December |
|
November – January (Northern production areas) |
Receiving and analysis of samples: |
Middle of December to middle of May |
Compiling of report: |
Middle of May to end of June |
Distribution of report: |
Middle of July |
Mixograph Classes
Voorbeelde van Mixogramkurwes / Examples of Mixogram Curves
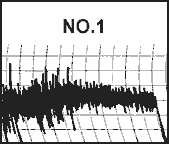
Onaanvaarbaar
Lae Proteien, %(12%vb) < 10%
Lang Piektyd, min.
Unacceptable
Low Protien, % (12 %mb) <10.0%
Long Peak Time, min.
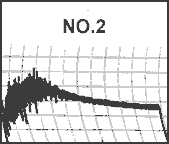
Onaanvaarbaar
Lae Proteien, %(12%vb) < 10.0%Kort Piektyd , min.
Unacceptable
Low Protien, % (12 %mb) <10.0% Short Peak Time, min.
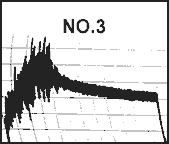
Onaanvaarbaar
Proteien, %(12 %vb) 10.0 – 13.0% Piektyd < 2.2 min.
Unacceptable
Low Protien, % (12 %mb) <10.0% Peak Time, < 2.2 min.
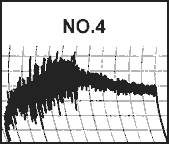
Anvaarbaar
Proteien, %(12 %vb) 10.0-13.0% Lang Piektyd, 2.2- 2.8 min.
Acceptable
Protein, % (12 %mb) 10.0 -13.0% Peak Time, 2.2- 2.8 min.
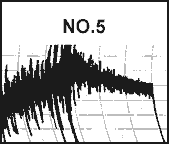
Aanvaarbaar
Proteien, %(12 %vb) 10.0-13.0% Lang Piektyd,2.9 – 3.3 min.
Acceptable
Protein, % (12 %mb) 10.0 -13.0% Peak Time, 2.9 – 3.3 min.
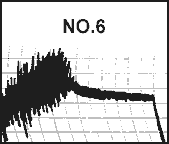
Onaanvaarbaar
Proteien, %(12 %vb) 10.0 – 13.0% Piektyd binne aanvaarbare riglyne maar te vinnige afbreking na piekhooghte
Unacceptable
Protein, % (12 %mb) 10.0 -13.0% Peak Time within acceptable norms but breakdown after Peak time too rapid
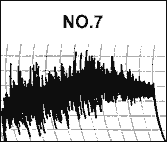
Onaanvaarbaar
Proteien, %(12 %vb) 10.0-13.0% Piektyd < 3.3 min. Nie so oorstabiel soos No.9 nie
Unacceptable
Protein, % (12 %mb) 10.0 -13.0% Peak Time < 3.3 min Not so unstable as No.9
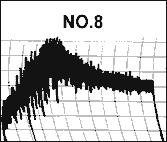
Onaanvaarbaar
Hoë Proteien, %(12 %vb) >13.0% Kort Piektyd min.
Unacceptable
Protein, % (12 %mb) > 13.0% Short Peak Time, min
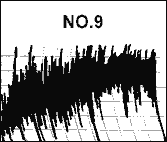
Onaanvaarbaar
Hoë Proteien,%(12 %vb)> 10.0 – 13.0% Lang Piektyd, oorstabiel
Unacceptable
Protein, % (12 %mb) > 10.0 -130% Long Peak Time, over stable

