The Southern African Grain Laboratory (SAGL) conducts an annual survey to evaluate the commercial wheat crop quality across the country. Using representative sampling methods, the survey provides reliable data on wheat crop quality and highlights regional differences. This information is compiled into a long-term database, providing policymakers with a valuable tool for monitoring agricultural trends, informing food security strategies, and supporting evidence-based decisions in the grain industry.
At 2 035 million tons, the 2024/25 season’s commercial wheat crop showed a 5.4 % increase from the previous season (1 930 million tons), which can be attributed to the increase in production from several of the regions, but in particular, the Free State, with an increase of 34.1 % and Limpopo Province, with an increase of 23.1 %, compared to the previous season. (Figures obtained from the Crop Estimates Committee.)
Representative crop samples, totalling 322, were received for analysis, of which 21 % were graded Super Grade (compared to 19 % in the previous season). The number of samples downgraded to Class Other Wheat (COW) increased from the previous season, from 25 % to 30 %. As in previous seasons, the main reason for samples being downgraded to COW was the percentages Other grain and Unthreshed ears; as well as Screenings exceeding the maximum allowable deviations of 1 % and 3 %, respectively.
The Hectolitre mass is a measurement that indicates the weight of a standard volume of grain, serving as a reflection of the grain’s bulk density and potential flour yield. Various factors, such as climatic conditions, frost damage, foreign matter in the grain, cultivar, grain size and shape, grain density, and wheat maturity, can influence the Hectolitre mass. The Hectolitre mass, at 80.3 kg/hl for the 2024/25 season wheat crop, averaged slightly lower than the previous season’s average value of 80.7 kg/hl. For whole wheat protein in South Africa as a whole, a slightly lower average value of 11.6 % was noted than in the previous season (11.8 %).
A total of 65 composite samples were prepared from the 322 wheat samples submitted and milled using a Bühler laboratory mill. A slight increase was noted in the average of 73.2 % flour extraction on the Bühler mill, compared with 72.8 % in the previous season.
Gluten value is directly proportional to protein content in wheat flour, which is illustrated in Figure 1, but they are not identical; protein is the material (glutenin and gliadin) from which gluten is formed when water is added to wheat flour. Therefore, a high protein content generally means a higher gluten-forming potential, with bread flour generally having more protein (and thus more gluten-forming potential) than cake or pastry flour. However, the final gluten baking quality depends on the ratio of glutenin (which contributes elasticity to dough) to gliadin (which contributes extensibility to dough) and other factors such as starch damage, which can affect dough behaviour.
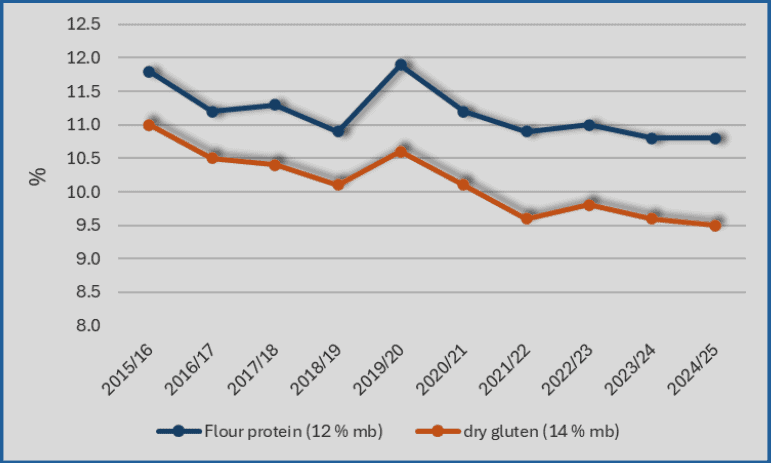
Figure 1: Flour protein (12 % mb) compared to Dry gluten (14 % mb) for seasons 2015/2016 to 2024/2025.
The difference between the two line graphs in Figure 1 (the protein graph is situated higher than the gluten graph) illustrates that the protein value is consistently higher than the dry gluten value. During the protein test, a sample of flour is combusted at high temperature, and the amount of Nitrogen (a component of protein) in the flour is determined. The Nitrogen value is converted to % protein. In the gluten test, a protein network is formed when water is added to the two primary gluten-forming proteins in wheat flour, glutenin and gliadin.
However, wheat flour also contains other proteins, such as albumins and globulins, which do not form gluten. These proteins are typically water-soluble and are washed away during gluten extraction. A total protein analysis measures all types of protein in the flour, while the gluten analysis only measures the portion that forms gluten.
The Alveograph test measures gluten strength and provides information relating to dough behaviour that can be expected during the fermentation and proving stages of baking. Dough Distensibility (L-value) indicates the extent to which the dough can stretch during the Alveograph test, and although high L-values relate to high loaf volumes, excessive stretching may cause sticky dough or unstable dough that could collapse in the oven. From seasons 2020/2021 to 2024/2025, Alveogram Distensibility has remained fairly stable, ranging between 121 and 130 mm (Fig. 2).
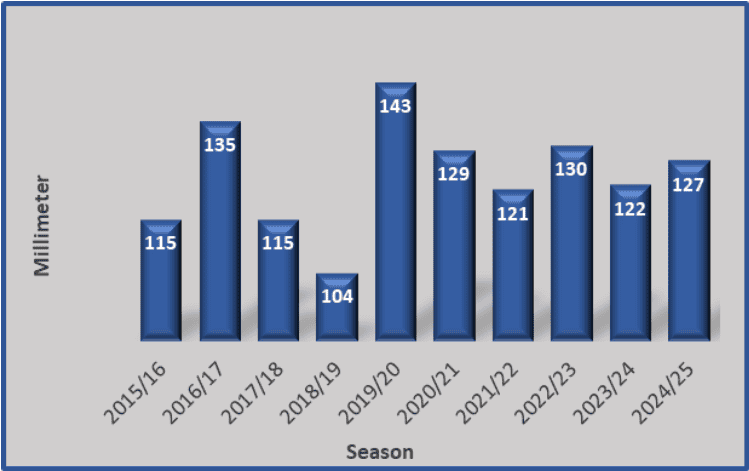
Figure 2: Alveogram Distensibility (mm) for seasons 2015/2016 to 2024/2025.
Alveogram Strength is a measure of dough’s resistance to deformation, and a high value (between 31.0 and 46.0 cm2 ) means the dough is strong and extensible, indicating good baking potential. Although the Alveogram Strength has remained within this range for the past 10 seasons, a steadily decreasing pattern was noted from 2021/2022 onwards (Fig. 3).
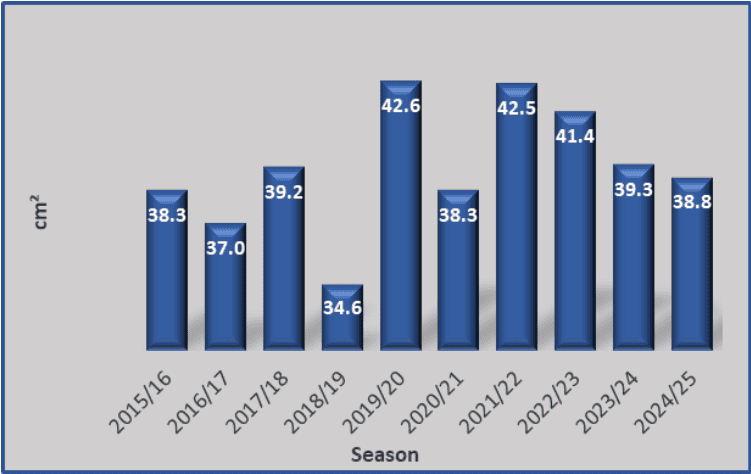
Figure 3: Alveogram Strength (cm2) for seasons 2015/2016 to 2024/2025.
Mycotoxins in food pose a health risk to both humans and animals, and South African legislation sets the maximum level of Aflatoxin in food for human consumption at 10 µg/kg, with aflatoxin B1 not exceeding 5 µg/kg. The maximum level of Deoxynivalenol (DON) permitted in cereal grains (wheat, maize and barley) intended for further processing is 2000 µg/kg and, for flour, meal and flakes derived from these cereals, the limit is 1000 µg/kg.
The mycotoxins currently of concern for the South African wheat crop are Deoxynivalenol (DON) and, to a lesser extent, Zearalenone (ZEA). None of the samples analysed contained ZEA, and the average DON level detected was 40 μg/kg. In comparison, the highest level detected was 72 μg/kg, well below the national maximum allowable level (2000 μg/kg) for cereals intended for further processing.
For more information, please consult the SAGL webpage: https://sagl.co.za/
With gratitude to the South African Winter Cereal Industry Trust for financial support of the annual crop survey, and to Agbiz Grain members for providing the crop samples.