
When decisions need to be made, the absence of or an incomplete or outdated database can cause significant problems to industry. This was the main reason for the Oil and Protein Seed Development Trust’s decision to fund the annual sunflower crop quality surveys eight years ago. It is, however, imperative to regularly review the scope of analysis included in these surveys to ensure that it fulfils the needs of the industry.
Precision Oil Laboratories, a laboratory that provides testing, training and consultation services to the oil industry, was consulted by a large seed oil producer in South Africa to determine if an unexpected variation of one of the fatty acids in a sunflower seed batch was acceptable. After extraction of the sunflower oil, it was rejected by a food processing company, indicating that one of the fatty acids was not within their specification. In the absence of an updated national database for the fatty acid composition of sunflower oil, the Codex Alimentarius (international food standards) was consulted, but it did not accommodate the range of the specific fatty acid in question.
After a literature search, the American database proved that wide ranges for the specific fatty acid were acceptable since specific factors, including drought, could lead to the fatty acid having increased acceptable ranges. The seed containing the fatty acid that was out of range was from a particularly dry season’s production – which explained the wide range. If a national database was kept and maintained, time and money lost by the industry as a result of rejected batches could have been avoided.
For this reason, it is important that South Africa, as a sunflower seed-producing country, develops and maintains a national fatty acid profile database to the benefit of the oilseed industry. The inclusion of fatty acid profile analyses from the 2018/2019 production season, is an exciting and important addition to the annual crop quality surveys conducted by the Southern African Grain Laboratory (SAGL).
Fatty acid profile analyses
Fatty acid profiles are the most important tool for the identification of authenticity of vegetable fats and oils. All types of oil have their own specific fatty acid profile, which is a combination of saturated, mono-unsaturated and poly-unsaturated oils and unique to that product or crop. Fatty acid profiles of every crop, however, are subject to variation.
The variation or typical pattern of fatty acids in a specific oil not only influences the stability and physical properties of the oil, but also aids in distinguishing one type of oil from another. Variation of fatty acids within the same product depends on climate, latitude, soil type, cultivar, rainfall as well as seasonal variation. These variations should be included when ranges for identification of authenticity are determined in order to successfully validate the authenticity of a specific vegetable oil.
Annual analysis of crop and cultivar samples will ensure that the natural variation caused by different cultivars as well as the influence of climate and locality are included and reflected in the database values. Seasonal variations will also be addressed. Recording all variations applicable to the crops in the database will enable the annual review of the specified ranges.
Precision Oil Laboratories was subcontracted to perform fatty acid profile analyses on 20 composite crop samples representing different production regions as well as 20 cultivar samples from different localities supplied by the ARC-Grain Crops. A total of 20 different fatty acids were included in the profile analysis. For more information on all the results obtained for this survey, please refer to the 2018/2019 Sunflower Crop Quality Report available on the SAGL’s website at www.sagl.co.za.
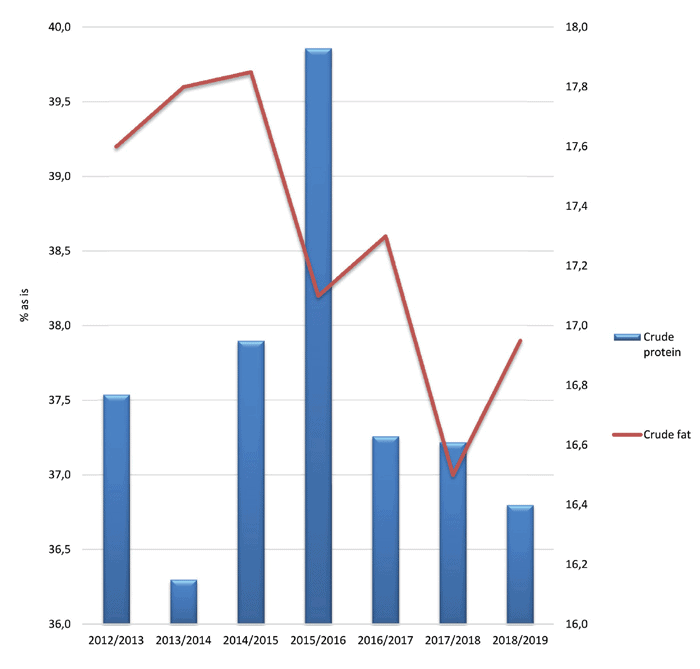
Graph 1: Crude protein and crude fat results of the sunflower crop samples over the last seven seasons.
Sampling
The survey included 176 composite samples, representing sunflower seed harvested and delivered to various delivery points throughout the sunflower production regions of South Africa during the second quarter of 2019. The samples, received by SAGL from June to October 2019, were selected to resemble the proportions per province according to the Crop Estimates Committee’s production estimates as closely as possible.
Grading results
76% (133) of the samples were graded as Grade FH1 according to the regulations relating to the grading, packing and marking of sunflower seed intended for sale in the Republic of South Africa (Government Notice No. 45 of 22 January 2016). The percentage of FH1 samples decreased compared to the 81% of the previous season. In the 2016/2017 season, this percentage was 85%.
43 samples were downgraded to Class Other Sunflower Seed. The main reason for downgrading the samples was as a result of the percentage of either the screenings or the collective deviations or a combination of both exceeding the maximum permissible deviations of 4% and 6% respectively.
Gauteng (three samples) reported the highest weighted average percentage screenings, namely 4,13%, followed by North West (58 samples) and Mpumalanga (eight samples) – both with 2,62%. Limpopo (twelve samples) reported the lowest average percentage of screenings of 1,47%. The weighted national average was 2,21% compared to the 1,91% of the previous season.
The highest weighted average percentage foreign matter (1,36%) was reported on the 95 samples from the Free State. North West followed closely with an average of 1,34%. The lowest percentages were found in Mpumalanga and Limpopo with 0,85% and 0,71% respectively. The South African average was 1,28% compared to 1,16% and 1,06% of the previous two seasons.
For this survey, the number of samples received that contained sclerotia from the fungus Sclerotinia sclerotiorum, increased from 78 samples (44%) in the previous season to 90 samples (51%) this season. 61 of these samples originated in the Free State, 25 in North West and two each in Mpumalanga and Gauteng. Four of these samples (one from North West, two from the Free State and one from Mpumalanga) exceeded the maximum permissible deviation of 4%. Weighted average levels ranged from 0% in Limpopo to 0,98% in Mpumalanga. The Free State’s weighted average was 0,49%. The national average of 0,43%, is the second-highest since the 0,53% of the 2013/2014 season. Last season’s average was 0,17%.
Nutritional content results
The weighted average crude protein content this season was 16,40%, compared to the 16,61% of the previous season. Limpopo had the highest weighted average crude protein content of 18,30% and Mpumalanga the lowest with 15,41%. Mpumalanga has consistently reported the lowest average protein content since the commencement of this survey in the 2012/2013 season. North West’s crude protein content averaged 16,71% and that of the Free State 16,06%. The weighted average crude fat percentage of 37,9% was almost 1% higher than last season’s 37,0%, but still the second-lowest of the last six seasons. Limpopo had the highest weighted average crude fat content of 39,0%, closely followed by Gauteng with 38,9%. The lowest average fat content was 37,6% of the North West. North West also reported the lowest average in the previous two seasons.
At 22,4%, the weighted average percentage of crude fibre was the highest of the last seven seasons (21,9% in 2017/2018). Average values varied between 20,2% in Limpopo to 23,0% in North West. The weighted average ash content was 2,60%, slightly lower than the 2,69% of the previous season. The provincial averages ranged from 2,37% in Mpumalanga to 2,64% in the Free State. The nutritional component analyses are reported as a percentage (g/100 g) on an ‘as received’ or ‘as is’ basis.
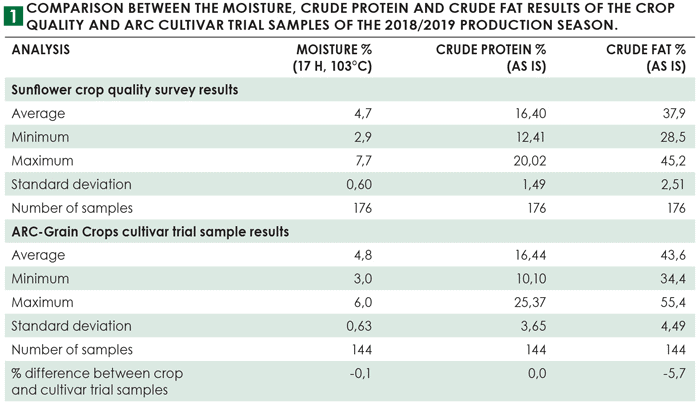
See Table 1 for a comparison of the moisture, crude protein and crude fat results between the crop survey and samples from the ARC-Grain Crops sunflower cultivar trials. The analyses on both sets of these samples were conducted by the SAGL.
Samples for the current (2019/2020) production season are expected to be received at the SAGL from June/July 2020. The results will be available on the SAGL website as soon as possible thereafter.