Quality Tested in Latest Survey
The second annual sorghum crop survey determined the quality of sorghum planted during the last quarter of 2018 and harvested during the first quarter of 2019. Each delivery of sorghum at the various delivery points throughout the sorghum production regions was sampled as per the regulations for grading purposes.
After grading, the grading samples were placed in separate containers according to class and grade, per silo bin/bag/bunker at each delivery point. After 80% of the expected harvest had been received, the content of each container was divided with a multi-slot divider in order to obtain a three-kilogram sample.
The samples were then marked clearly with the name of the depot, the bin/bag/bunker number(s) represented by each individual sample as well as the class and grade, and then forwarded to the Southern African Grain Laboratory (SAGL). The samples received at the SAGL were selected to proportionally resemble as closely as possible the Crop Estimates Committee’s production estimate figures per province.
Grading results
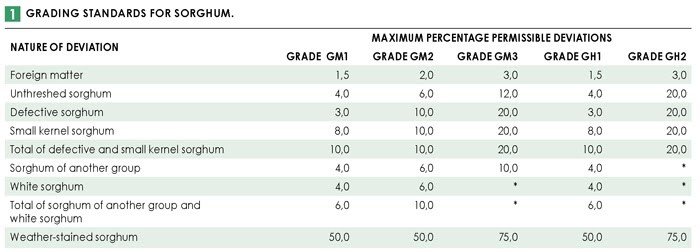
Full grading was done in accordance with the regulations relating to the grading, packing and marking of sorghum intended for sale in the Republic of South Africa (Government Notice No. R.15 of 8 January 2016). 65% (20) of the 31 samples analysed for the purpose of this survey were determined to be class GM. Of these, 18 samples (90%) were graded as GM1. One sample each was graded GM2 and GM3. The remaining eleven samples were all class GH. Ten of these samples were graded GH1 and one was graded GH2. Please see Table 1 for the grading standards for sorghum.
Class GM sorghum consists of malt sorghum that does not have a dark-pigmented testa. The testa is the seed coat layer just beneath the outer coating (pericarp) of a sorghum kernel. Class GH sorghum consists of malt sorghum that has a dark testa containing condensed tannins. Tannins protect the kernel against preharvest germination and attack by insects, birds and moulds. Condensed tannins are an important quality parameter due to their effects on nutritional and sensory (taste and texture) quality.
Mpumalanga (ten samples) had the highest percentage foreign matter (0,74%) for GM sorghum, while the Free State (four samples) showed the highest foreign matter percentage (1,21%) for GH sorghum. The national weighted averages were 0,62% and 0,78% for GM and GH sorghum respectively.
The percentage defective GM sorghum was the highest (1,02%) in the eight samples from Limpopo. North West (four samples) had the highest percentage of defective GH sorghum (1%). The national averages were very similar: 0,70% for GM and 0,71% for GH. As in the previous season, GH sorghum showed the highest percentages of small kernels (national average 1,35%), with the sample from Limpopo having the highest percentage, namely 1,60%. GM sorghum had the lowest percentage of small kernels in the Free State (0,54%) and averaged 0,96%.
Physical parameters
GM sorghum had the highest weighted average test weight, namely 78,9 kg/hl, while GH sorghum averaged 77,3 kg/hl. Test weight values for GM sorghum ranged between 74,0 kg/hl and 81,2 kg/hl. GH values varied from 76,2 kg/hl to 78,9 kg/hl.
Test weight was determined with the Kern 222 instrument on unscreened samples. GM sorghum also had the highest 1 000 kernel mass values, ranging between 19,4 g and 30,0 g (14% moisture basis) and averaging 25,5 g. GH sorghum averaged 24,4 g and varied between 19,8 g and 29,4 g.
Sorghum kernel size is determined by means of image analysis. Sorghum kernels were photographed on a Panasonic Lumix digital camera (DNC-LX3). Photos were analysed afterwards using Digimizer version 4,0 software supplied by Medcalc (www.digimizer.com), to measure the size of the sorghum kernels. Measurements taken are maximum length (indicated as ‘length’) and minimum length (indicated as ‘width’) both reported in millimetres, relative kernel roundness (width divided by length, expressed as a percentage or W/L%), as well as the volume to surface ratio, also reported as a percentage.
Image analysis results showed that the GM sorghum on average had longer and slightly wider kernels than the GH sorghum. The variation (indicated by the standard deviation) in these parameters is similar for both GM and GH sorghum. Kernel roundness (defined as W/L%) showed a wider variation as can be expected, with a standard deviation of 4,6% for GM and 4,9% for GH sorghum. A totally round kernel will have a W/L% of 100.
The more uniform the kernel size and shape of sorghum grain within a cultivar – but also between cultivars – the easier it will be for processors to consistently produce quality products and minimise processing losses.
Chemical composition and colour
The crude protein and total starch contents measured were calculated and reported on a dry basis (db). North West had the highest protein average of 11,9% for GM sorghum, while Mpumalanga averaged the lowest with 10,4%. North West and Limpopo both averaged the highest (11,0%) for GH sorghum, and Mpumalanga averaged the lowest at 10,3%. Nationally, GM and GH sorghum averaged 11,0% and 10,7% respectively. The highest total starch content for GM sorghum was reported in Mpumalanga (72,7%), followed closely by North West with 72,6%. Mpumalanga also reported the highest total starch content for GH sorghum, namely 70,1%. The weighted total starch content of GM sorghum was 71,9% and that of GH sorghum 69,4%. Please see Graph 1 and Graph 2.
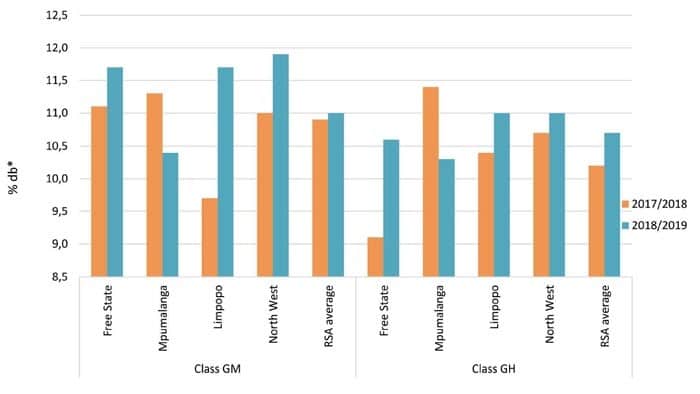
Graph 1: Average percentage of crude protein per class per province over two seasons. *dry/moisture-free basis
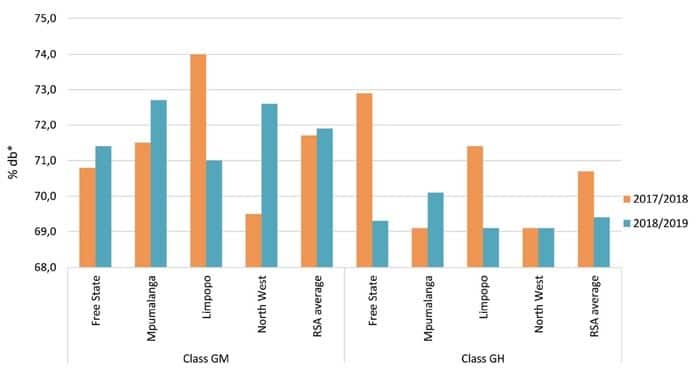
Graph 2: Average percentage of total starch per class per province over two seasons. *dry/moisture-free basis
Colour determinations were done on a milled fraction of dehulled samples above the 1,8 mm slotted sieve. Dehulling of the samples (removal of the pericarp and testa) was done by means of a barley pearler, followed by milling on a Retch ZM 200 mill fitted with a 0,5 mm screen.
The milled samples’ colour was determined with a HunterLab Color-Flex 45/0 spectrophotometer on a 10° observer angle/D65 setting. The spectrophotometer operates in the Hunter L, a, b scale where ‘L’ measures lightness and varies from 100 for perfect white to zero for black, approximately as it would be evaluated by the eye. ‘a’ measures redness when positive, grey when zero and greenness when negative and ‘b’ measures yellowness when positive, grey when zero and blueness when negative. Please see Table 2 for the results obtained.
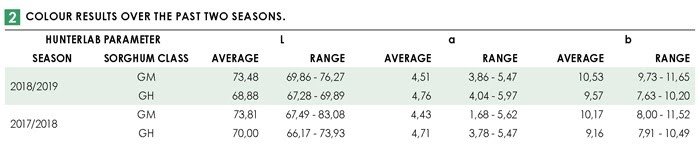
Although there are currently no acceptable ranges for these parameters defined, the colour must be within the consumer-acceptable range, which traditionally are products with a slightly pink hue. Not only the dehulling process but also other traits such as pigmentation differences determine the end product colour.
Mycotoxins
Mycotoxins are fungal metabolites, toxic to animals and humans, that are produced by moulds commonly found in almost all types of grain. Aside from health risks, mycotoxin contamination also reduces the value of the crops. Environmental factors such as temperature, humidity, soil and storage conditions influence mycotoxin production.
Analyses for mycotoxins were performed on all 31 sorghum crop samples. The samples were tested by means of a SANAS ISO/IEC 17025 accredited multi-mycotoxin screening method using UPLC-MS/MS. With this technique, simultaneous quantification and confirmation of aflatoxins (B1; B2; G1; G2), fumonisins (B1; B2; B3), deoxynivalenol, 15-ADON, HT-2 toxin, T-2 toxin, zearalenone and ochratoxin A are possible in one run.
The average fumonisin level (sum of B1, B2 and B3) on all 31 samples tested, was below the limit of quantitation (LOQ = 20 μg/kg) and ranged from not detected (ND) to 213 μg/kg. Of the 31 samples tested, four samples (13%) tested positive for fumonisins and the average of these positive results was 98 μg/kg.
199 μg/kg was the highest deoxynivalenol (DON) level detected. The average level of all samples tested this season was below the limit of detection (LOD = ND). 13% of the samples tested positive for DON and the average of these positive results was 147 μg/kg.
Zearalenone residues were found in two (6%) of the samples, with values of 55 μg/kg and 78 μg/kg each. The average of these positive samples was 67 μg/kg. In the previous season, none of the samples tested positive for any of these mycotoxins.
Imported sorghum
During the last marketing season (March 2019 to February 2020) 59 253 tons of sorghum were imported, compared to the 45 739 tons and 55 824 tons of the prior two seasons respectively. A subsample of all samples drawn by inspectors of the South African Agricultural Food, Quarantine and Inspection Services (SAAFQIS) of the Department of Agriculture, Land Reform and Rural Development (DALRRD) is forwarded to the SAGL for analysis.
To assist with quality comparisons between local and imported sorghum, the same scope of analysis is used for both sets of samples. 15 imported sorghum samples were received at the SAGL, with 13 originating from the United States of America and two from Argentina. Three samples were graded GM2, eleven samples were graded GM3 and one sample as Class Other Sorghum.
The average percentage deviations within a grade were higher on the imported sorghum samples, most notably on small kernel sorghum, white sorghum, a total of sorghum of another group and white sorghum as well as weather-stained sorghum.
Average test weight and 1 000 kernel mass values were lower than that of local sorghum. Image analysis results between local and imported sorghum kernels compared well. Standard deviation values on the imported samples were higher on average, indicating larger variation between kernels.
The protein content was on average lower and the starch content higher on imported sorghum compared to local sorghum. Mycotoxin levels measured on the imported samples did not raise any concerns.
For detailed information on the results obtained with this survey, please refer to the 2018/2019 Sorghum Crop Quality Report available on the SAGL website at www.sagl.co.za.
