The 2018/2019 season represented the 21st annual wheat crop quality survey. The aim of these surveys is to accumulate commercial wheat crop quality data on a national level to assist the industry in decision-making processes. A total of 337 wheat crop samples from 28 different regions throughout the wheat producing areas of South Africa were graded and analysed.
Quality
The average hectolitre mass increased by 0,6 kg/hl to 81,3 kg/hl compared to the previous season. The nine-year average for determinations done by means of the Kern 222 instrument is 80,7 kg/hl. Eight samples reported values below the 77 kg/hl minimum level for grade B1 wheat. Of these, four samples originated in the Western Cape (winter rainfall area) and two each in the Free State and Mpumalanga. The regional averages ranged from 79,9 kg/hl in the Western Cape to 83,1 kg/hl in the irrigation areas. All national, seasonal and regional averages reported are weighted averages
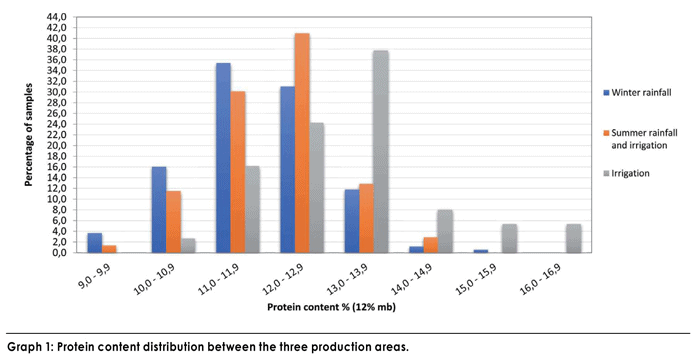
During this season the whole wheat protein average of 12,1% decreased by 0,5% compared to the previous season. The ten-year national average is 11,9%. The percentage of samples with a protein content exceeding 12% decreased from 63,5% in 2017/2018 to 53,7% this season. This decrease can be attributed to the severe drought conditions experienced in the Western Cape last season that led to above-average protein values being observed. During the 2016/2017 season, this percentage was 47,8%. The protein content is reported on a 12% moisture basis (mb).
The summer rainfall and irrigation areas of the Free State reported the highest whole wheat protein average, namely 13,1%. The irrigation areas averaged 12,1% and the production regions in the winter rainfall area of the Western Cape 11,8%. See Graph 1.
A national weighted average falling number value of 397 seconds was recorded – higher than last season’s average as well as the ten-year weighted average value (both 371 seconds). Five of the samples analysed for this survey reported falling number values below 250 seconds and of these only one was below 220 seconds. The samples originated from North West, Mpumalanga and Limpopo. From the results of the 21 surveys, the conclusion can be made that low falling numbers are not a major concern for local wheat producers.
The weighted average percentage screenings obtained with a 1,8 mm slotted sieve was 1,49% – slightly lower than the previous season’s 1,51% and also the lowest value of the last six seasons. The winter rainfall areas reported the highest average percentage, namely 1,80% and the irrigation areas the lowest of 1,07%. Of the 337 samples, 24 (7%) exceeded the 3% maximum permissible screenings level for grade B3 and of these, nine exceeded the 4% maximum permissible level for grade B4. Most of these samples originated in the Western Cape.
45% of the samples were graded as B1, 26% as B2, 9% as B3, 4% as B4, 14% as Utility Grade (UT) and 2% as Class Other Wheat (COW). The majority of samples (75%) downgraded to UT was as a result of either the percentage screenings or mainly the percentage other grain and unthreshed ears, individually or in combination with the combined deviations, exceeding the maximum allowable level for grades B1 to B4. Most of these downgraded samples originated from the Western Cape. Grade B1 wheat in the Free State amounted to 68% (51% in the previous season). In the irrigation areas, 50% (43% in the previous season) of the wheat was graded as B1 and in the Western Cape, 37% was graded as B1 (48% in the previous season).
The 1000 kernel mass, reported on a 13% moisture basis, increased from 37,7 g last season to 39,2 g this season. The 2016/2017 season’s average was 38,6 g. Averages over production areas varied from 36,1 g in the Free State to 40,2 g in the irrigation areas.
Mixogram peak time of flour milled on the Quadromat Junior mill averaged 2,8 minutes and compared well with the 2,7 minutes of the previous three seasons. The ten-year average is 2,9 minutes. The mixogram peak time of flour milled on the Bühler laboratory mill was on average 2,6 minutes, equal to the previous three seasons. The extraction on the Bühler MLU 202 mill decreased to 71,3% this season.
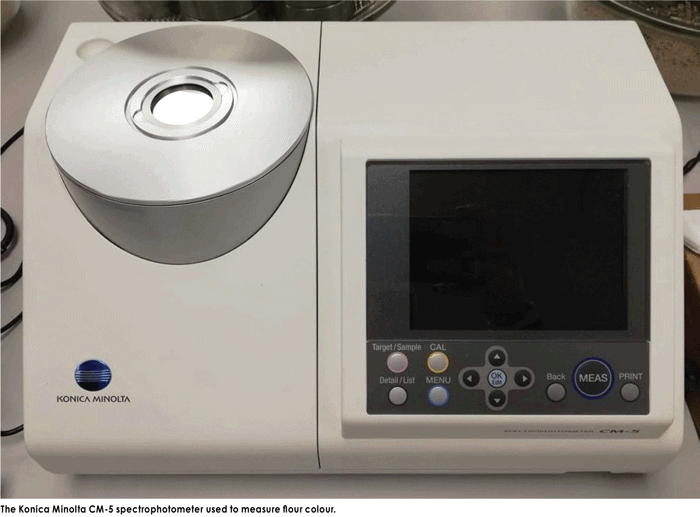
Colour is an important parameter of milled wheat since the colour of wheat flour affects the colour of the finished product, like the crumb colour of a loaf of bread. Generally speaking, a bright white-coloured flour is more desirable for most products. The Konica Minolta CM-5 spectrophotometer measures flour colour by means of the CIE L*a*b* (CIELAB) colour model. The model uses lightness (L*) and two colour values (a* and b*). These colour coordinates define where a specific sample’s colour lies in a Cartesian graph. L* represents lightness (100 being white and 0 being black), a* represents green to red variation and b* represents a variation from blue to yellow. The results reported are for the 10° observer and D65 illuminant. The colour is measured ‘as is’, in other words on a dry sample and does not require a slurry as in the case with other instruments like the Kent-Jones instrument.
Mill settings (how hard the wheat is ground) and the resultant extraction rate as well as the choice of different mill streams being combined into a specific type of flour, determine the colour of a flour sample. Wheat colour (white versus red), cultivar as well as soil mineral composition are also factors affecting flour colour with regards to lightness and yellowness.
Since these samples were all milled on the same laboratory-scale Bühler MLU 202 mill without any setting changes, the variation in colour values observed in Graph 2 to Graph 4 excludes milling effects. Looking at the range of results per parameter, the variation in results is less than might have been suspected, given that these are the results of 490 composite samples representing wheat from the entire wheat production area over seven seasons. Keep in mind that the minimum value is based on a single composite sample’s result in a specific season.
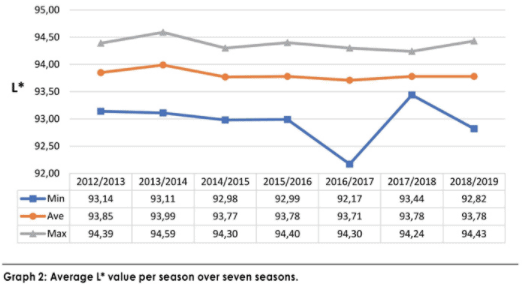
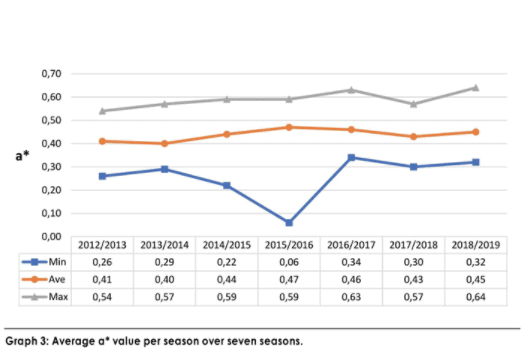
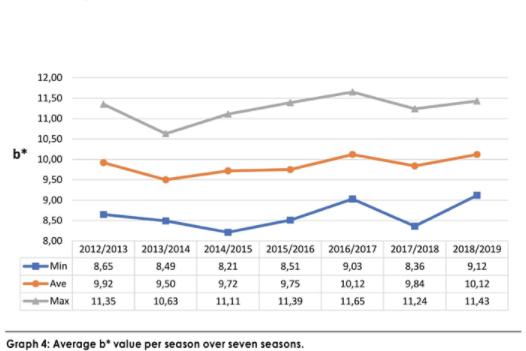
The ranges in values for L*, a* and b* respectively are 2,42, 0,58 and 3,44. The reproducibility of the methodology based on duplicate determinations of identical test material where laboratory, operator and equipment can vary, is 1,268, 0,222 and 0,894 respectively.
Flour protein content decreased from 11,3% last season to 10,9%. Wet gluten averaged 30,1% and dry gluten 10,1% – both on a 14% moisture basis. In the previous season, these values averaged 30,7% and 10,4% respectively. The average gluten index value was 94 (93 last season), ranging between 71 and 99. The gluten index provides an indication of the gluten strength (higher being better) and is not influenced by the protein content. A value between 70 and 100 is generally accepted as good quality for pan bread-baking purposes. The average ash content was calculated to be 0,60% on a dry basis (moisture-free basis), equal to the previous season.
The farinograph analysis resulted in average water absorption of 60,5% (60,3% in the previous season) and an average development time of five minutes (5,5 minutes in the previous season). The stability value of seven minutes was one minute shorter than the previous average, but still within the acceptable range.
Average alveogram strength was 34,6 cm² and the average P/L value 0,81 (39,2 cm² and 0,81 in the previous season). The distensibility of the dough as determined by the alveograph decreased compared to the previous season, indicating a more elastic dough. The stability value was equal to last season.
The average extensogram strength was 92 cm² (106 cm² during the previous season), confirming the weaker dough strength trend this season observed with the alveograph. The maximum height in Brabender units were also lower than last season (350 BU in 2018/2019 and 382 BU in 2017/2018). The extensibility values compared well: 191 mm now and 198 mm previously.
Mycotoxins
The accredited multi-mycotoxin assessments (included in the annual wheat crop quality survey for the past nine seasons) provide the most comprehensive overview of the multi-mycotoxin risk in commercial wheat produced and delivered to commercial grain storage companies in South Africa.
40 wheat samples, randomly selected to represent different regions and grades, were tested. Of these, five samples tested positive for deoxynivalenol (DON) residues. The average value of the five positive results was 217 µg/kg (ppb) and the highest value measured 361 µg/kg, which is well below national and international maximum allowable levels.
Amendments to Government Notice No. R. 1145, dated 8 October 2004, published in Government Notice No. 987 of 5 September 2016, specify that: Cereal grains (wheat, maize and barley) intended for further processing, may not contain more than 2 000 µg/kg of deoxynivalenol. Flour, meal, semolina and flakes derived from wheat, maize or barley, ready for human consumption, may not contain more than 1 000 µg/kg of deoxynivalenol.
Mycotoxin risk in grain produced differs from season to season in the same region and also from region to region because the occurrence and concentration levels of mycotoxins are influenced by climatic factors during the preharvest production period. Annual survey results of mycotoxin contamination in local as well as imported wheat and other grains are thus critically important.
Amino acid profile
Amino acid composition is an important feature in determining the nutritional value of wheat for human and animal diets since amino acids are the building blocks of proteins. Protein and amino acid composition of wheat varies according to cultivar, application of fertilisers (especially variation in nitrogen and sulphur application), irrigation practices, soil composition and climatic conditions.
The results of the 18 amino acids included in the SAGL analyses on 40 samples were reported as g amino acid/100 g samples. The values obtained for all amino acids on these samples were within the normal range reported for wheat in literature – deficient in certain essential amino acids, such as tryptophan, lysine, threonine, methionine and histidine, but high in glutamic acid and proline. For more information on the results, please refer to the 2018/2019 Wheat Crop Quality Survey report available on the SAGL website (www.sagl.co.za).
Imported wheat
South Africa is a net importer of wheat and relies on imports to supply local demand. Therefore, monitoring the quality of imported wheat is important to the entire wheat value chain. During the period 1 October 2017 to 30 September 2018, 231 samples of wheat imported for local use, representing 2 173 234 tons of wheat, were received and analysed from the following eleven countries of origin (number of samples received in brackets): Argentina (28), Canada (9), the Czech Republic (6), Germany (27), Latvia (7), Lithuania (10), Poland (5), Romania (12), the Russian Federation (99), Ukraine (10) and the United States of America (USA) (18). Wheat imported for purposes other than bread baking (e.g. soft types for biscuit making) is included in this data set.
7% of the samples had hectoliter mass values below 77 kg/hl (minimum requirement for South African grade B1 wheat), compared to the 18% and 7% of the previous two seasons. These samples originated from Argentina, Germany, Romania, the Russian Federation and the USA, which reported the lowest hectoliter mass values overall.
Screenings represent all material that passes through a standard sieve (1,8 mm), with 3% the maximum allowed for grades 1 to 3 according to South African grading regulations. Samples from the Russian Federation and the USA also reported the highest levels of screenings, which explains at least in part, the low hectolitre mass values observed on these samples.
None of the samples reported falling number results below 220 seconds. The wheat imported from Romania had the highest average falling number value, which equalled the South African national average for the same season.
As in previous seasons, a general trend towards lower gluten contents, lower farinograph water absorptions and shorter development times, lower alveograph strengths and shorter distensibility values (leading to higher P/L values) compared to South African wheat were observed. This observation excludes the wheat originating in Canada.
Most of the imported wheat samples again showed a tendency towards longer mixogram mixing times (in excess of four minutes). Some of these long mixing times can be explained by low protein levels in the samples. Flours having undesirably low
protein starch ratios require more time to produce continuous protein phases during mixing. Mixing time provides an indication of the amount of time needed to mix the dough to optimum development – between 2,8 and 3,5 minutes are considered acceptable in South Africa.
Composite samples of holds per shipment per country were tested for the presence of mycotoxin residues by means of a multi-mycotoxin analysis. A total of 78 samples were tested and the mycotoxin results, in general, did not raise any concerns. DON residues were observed on some of the samples, but none of the levels exceeded national or international maximum allowable levels. Ochratoxin A residues were observed on one sample from Canada and this value exceeded the maximum allowable level of amongst other the European Union and Codex.
To date (16 August 2019) 997 752 tons of wheat have been imported for the 2018/2019 marketing season according to the South African Grain Information Service (SAGIS). 31% of this wheat originated in Germany.
Our sincere appreciation to the Winter Cereal Trust for financial support of this annual survey, to Agbiz Grain members for providing the crop samples as well as to departmental inspectors at the harbours for providing representative samples of each shipment of imported wheat.