The 2016/2017 sunflower crop quality survey is the fifth annual survey performed by the Southern African Grain Laboratory (SAGL). The goal of this survey is to compile a detailed database, by accumulating quality data collected on the national commercial sunflower crop over several seasons.
This essential database can assist the industry in decision-making processes. The data reveal general tendencies and highlight quality differences in the commercial sunflower produced in different local production regions.
Quality analyses, which included grading, were performed on 176 composite samples. These composite samples, representing each delivery of sunflower seed at the various silos throughout the sunflower production regions, were taken according to the prescribed grading regulations, during the 2017 harvesting season.
Grading was done in accordance with the regulations relating to the grading, packing and marking of sunflower seed intended for sale in South Africa (No. R 45 of 22 January 2016). 85% (150) of the samples were graded as Grade FH1, with 26 of the samples downgraded to class other sunflower seed (COSF). The percentage of FH1 samples increased compared to the 78% of the previous season and is similar to the 86% of the 2014/2015 season. The majority (17) of the samples was downgraded as a result of the percentage of either the screenings or the collective deviations or a combination of both, exceeding the maximum permissible deviations of 4% and 6% respectively. Other deviations resulting in the downgrading of samples were the percentage damaged sunflower seed, the percentage foreign matter, the percentage sclerotia as well as the presence of an undesired odour in the samples.
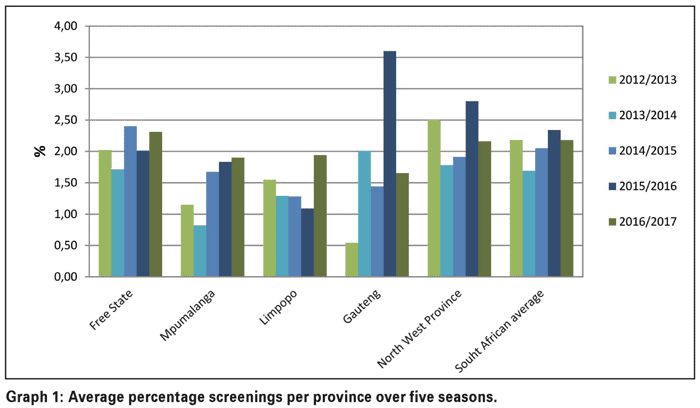
Refer to Graph 1 and Graph 2 for the weighted average percentage of screenings and foreign matter per province over five seasons.

The number of samples received for this survey that contained sclerotia from the fungus Sclerotinia sclerotiorum, increased from 18 samples (10%) in the previous season, to 28 samples (16%) this season. 14 of these samples originated in the Free State, 13 in North West Province and one in Mpumalanga.
The highest percentage (5,52%) was present in a sample from North West Province and this was the only sample that exceeded the maximum permissible deviation of 4%. Weighted average levels ranged from 0,06% in the Free State to 0,18% in North West Province. The national average of 0,11% was slightly higher than the 0,04% of the previous two seasons.
Although test weight does not form part of the grading regulations for sunflower seed in South Africa, the g/1 L filling weight of each sunflower seed sample was determined by means of the Kern 222 apparatus. The test weight values were then extrapolated by means of formulae obtained from the test weight conversion chart for sunflower seed oil of the Canadian Grain Commission. These approximated values provide a measure of the bulk density of South African sunflower seeds.
Over the past three seasons, the national weighted average test weight varied between 42,1 kg/hl in the season under discussion, 42,5 kg/hl during the previous season and 44,2 kg/hl in the 2014/2015 season.
Regionally, the weighted average test weights this season ranged from 41,3 kg/hl in the Free State to 42,7 kg/hl in North West Province.
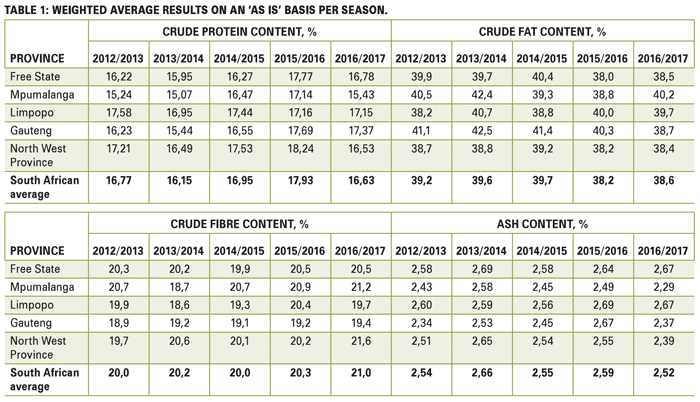
The nutritional component analyses, namely crude protein, -fat, -fibre and ash, are reported as % (g/100 g) on an ‘as received’ or ‘as is’ basis. See Table 1 for a summary of the results obtained over five seasons.
Visit www.sagl.co.za for detailed results of this, as well as previous surveys. The reports are also available for download in a PDF format.
