Wheat contributed 79% to the total winter cereal crop production in South Africa during the 2017/18 production season. The Southern African Grain Laboratory NPC (SAGL) received and analysed 304 samples to provide as best possible a proportional representation of the production of wheat in all the different production regions.
The majority of the samples (71%) downgraded to Utility Grade was as a result of either the percentage screenings or mainly other grain and unthreshed ears, individually, or in combination with the combined deviations, exceeding the maximum allowable level for grades B1 to B4. Most of these downgraded samples originated from the Western Cape.
Grade B1 wheat in the Free State province amounted to 51% (71% in the previous season). In the Irrigation areas, 43% (52% in the previous season) of the wheat was graded as B1 and in the Western Cape Province, 48% was graded as B1 (22% in the previous season).
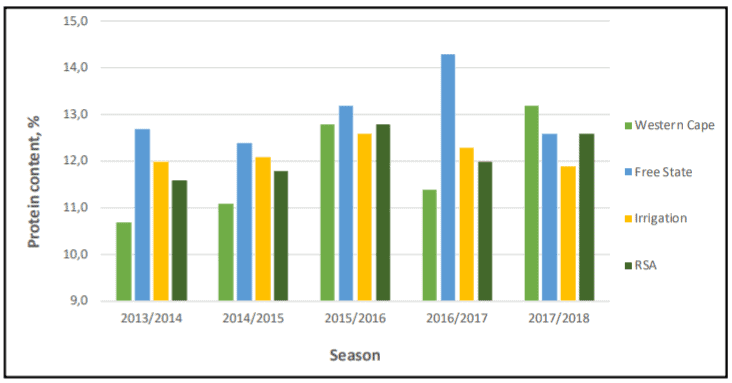
Figure 1: Protein content distribution per production area over the last five seasons.
The national whole wheat protein average increased from 12,0% in the previous season to 12,6%, the ten-year national average is 11,9% (Figure 1). This is the second-highest average since the 2004/05 season and can be attributed to the above-average protein values observed in the winter rainfall area of the Western Cape where severe drought conditions were experienced. The Winter rainfall area reported its highest protein average of 13,2% since the start of this annual survey twenty years ago. The Irrigation areas averaged 11,9% and the production regions in the Free State province 12,6%. The percentage of samples having protein contents higher than 12,0% increased from 47,8% last season to 63,5%. During the 2015/16 season, this percentage was 68,2%. The protein content is reported on a 12% moisture basis.
The average hectoliter mass nationally was 80,7 kg/hl, slightly lower than the 81,5 kg/hl of the 2016/17 season. This value also compares very well with the eight-year weighted average of 80,6 kg/hl for determinations done by means of the Kern 222 instrument. Of the 31 samples that reported values below the 77 kg/hl minimum level for grade B1 wheat, 26 originated in the Western Cape (as can be expected due to the drought), while the remaining five samples originated in the Free State production regions. The regional averages ranged from 79,1 kg/hl in the Western Cape to 83,2 kg/hl in the Irrigation areas. The 1000 kernel mass, reported on a 13% moisture basis, decreased from 38,6 g last season to 37,7 g this season. The 2015/16 season’s average was 36,8 g. Averages over production areas varied from 36,2 g in the Western Cape to 39,6 g in the Irrigation areas.
- Most of the wheat samples downgraded to Utility Grade originated from the Western Cape.
- The whole wheat protein average increased to 12,6%, the second-highest average since the 2004/05 season.
- The results of the average falling number, as well as previous surveys, provide evidence that low falling number values are generally not a problem.
The weighted average percentage screenings obtained with a 1,8 mm slotted sieve was 1,51%, 0,35% lower than the previous season and also the lowest value of the past five seasons. The Winter rainfall area reported the highest average percentage, namely 1,79% and the Irrigation areas the lowest of 1,05%. 28 of the 304 samples exceeded the 3% maximum permissible screenings level for grade B3 and of these 11 exceeded the 4% maximum permissible level for grade B4. Most of these samples originated in the Western Cape.
The average falling number this season was 371 seconds. Five of the samples analysed gave falling number values below 250 seconds and of these, four were below 220 seconds. All but one of these samples originated in the Free State area, the other sample in the Western Cape. The highest average falling number value of 385 seconds was reported for the Irrigation areas. The results of this, as well as previous surveys, provide evidence that low falling number values are generally not a problem experienced in South Africa.
Table 1: Average quality of local wheat over 4 seasons.
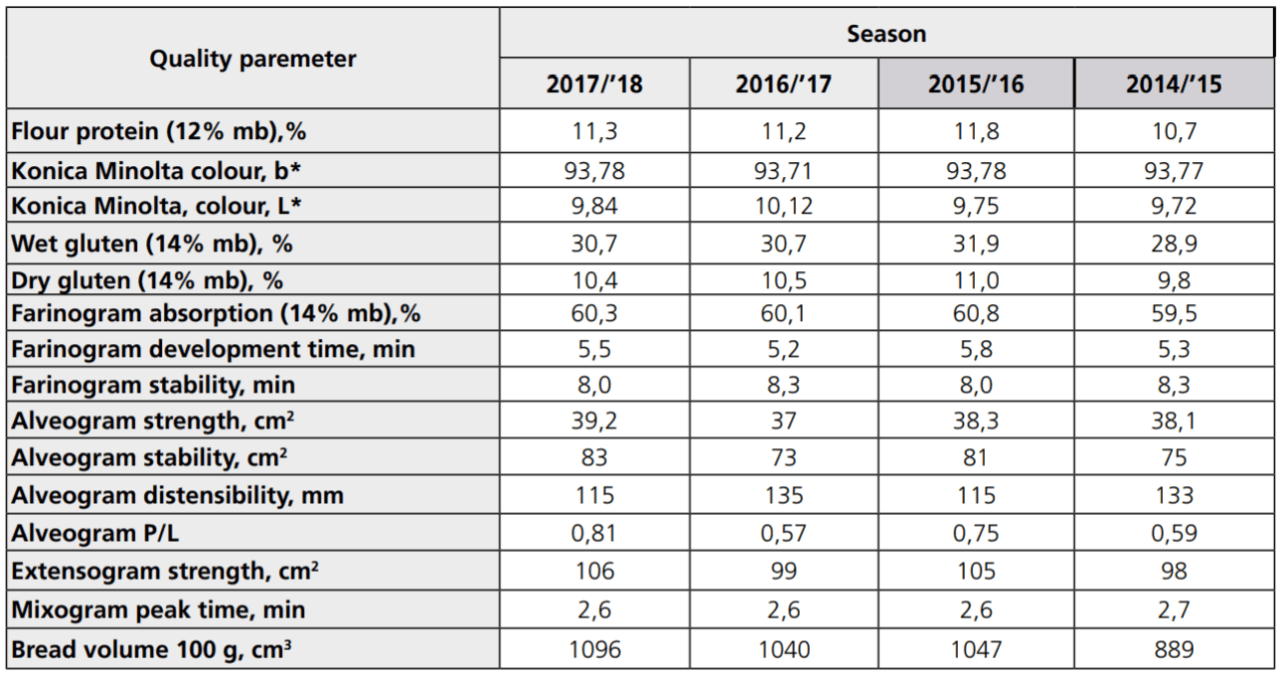
See Table 1 for a comparison of the average quality results of local wheat over the last four seasons. It is interesting to note that the average values of the 2017/18 and 2015/16 seasons’ farinograph, alveograph and extensograph results are almost identical, while the 2016/17 and 2014/15 results are very similar. A decrease in the alveogram distensibility with a resulting increase in P/L value is indicative of a more elastic dough.
Mycotoxins
Mycotoxins, toxic chemical compounds produced by moulds, can contaminate commodities either in the field or during storage and are invisible, odourless and tasteless. Mycotoxin production is foremost a food safety issue, although the occurrence of moulds can also lead to damage ranging from rancidity, odour, flavour changes, loss of nutrients and germ layer destruction resulting in a reduction in quality. Most mycotoxins are toxic in very low concentration, so this requires sensitive and reliable methods for their detection.
According to the Food and Agriculture Organisation, food losses due to mycotoxin contamination are estimated at 25% on a global scale and pose a real threat to food security, especially in Africa where the magnitude of losses is difficult to estimate because of a lack of information. Effective management to prevent food losses or adverse health effects as a result of long-term exposure to contaminated food is only possible when adequate reliable testing data is available. Well-timed interventions in the food and feed value chain can then be based on these testing results.
The accredited multi-mycotoxin assessments included in the annual wheat crop quality survey for the past eight seasons, provide the most comprehensive overview of the multi-mycotoxin risk in commercial wheat produced and delivered to commercial grain storage companies in South Africa. Forty wheat samples, randomly selected to represent different regions as well as grades, are analysed annually.
The absence of Aflatoxin B1, B2, G1, G2, Fumonisin B1, B2, B3, Ochratoxin A, Zearalenone, T2-toxin and HT-2 toxin in the wheat samples over the past seven seasons were confirmed in the 2017/18 season. The samples that did test positive for Deoxynivalenol (DON) residues this season, were all well below national and international maximum residue levels, as was the case in previous seasons. The average value of the seven positive results was 202 µg/kg (ppb) and the highest value obtained 570 µg/kg. Last season, four samples tested positive for DON residues with an average value of 289 µg/kg (ppb), the highest value obtained was 501 µg/kg.
Please visit SAGL’s website, www.sagl.co.za, for detailed results on local as well as imported wheat quality surveys. The crop quality reports can also be downloaded in a PDF format.
The Southern African Grain Laboratory NPC renders sincere appreciation to the Winter Cereal Trust for financial support of this annual survey, to Agbiz Grain members for providing the crop samples, as well as DAFF inspectors at the harbours for providing representative samples of each shipment of imported wheat.