Mycotoxins, toxic chemical compounds produced by moulds, can contaminate commodities either in the field or during storage and are invisible, odourless and tasteless. The only proven way to determine whether grain, feed or food are contaminated, is by analytical testing.
According to the Food and Agriculture Organization, food losses due to mycotoxin contamination are estimated at 25% on a global scale and pose a real threat to food security, especially in Africa where the magnitude of losses is difficult to estimate because of a lack of information.
Mycotoxin production is foremost a food safety issue, although the occurrence of moulds can also lead to damage ranging from rancidity, odour, flavour changes, loss of nutrients and germ layer destruction resulting in a reduction in quality. Most mycotoxins are toxic in very low concentrations, so this requires sensitive and reliable methods for their detection.
Effective management to prevent food losses or adverse health effects as a result of long-term exposure to contaminated food is only possible when adequate reliable testing data is available. Well-timed interventions in the food and feed value chain can then be based on these testing results.
The multi-mycotoxin assessments included in the annual maize crop quality survey for the past seven seasons provide the most comprehensive overview of the multi-mycotoxin risk in commercial maize produced in South Africa. Approximately 35% of the maize crop samples were selected every season for multi-mycotoxin analyses to proportionally represent all the production regions, as well as both white and yellow maize.
The mycotoxins regulated in South Africa are Aflatoxin B1 and Aflatoxin total, Fumonisins (FUM) B1 + B2 and Deoxynivalenol (DON). These mycotoxins, as well as nine other mycotoxins of most concern globally, are included in the LC-MS/MS analysis used by the Southern African Grain Laboratory (SAGL).
In total 62% of the 2016/2017 season’s tested maize samples contained one or more mycotoxin, similar to the previous season when 63% of the samples tested positive for one or more mycotoxin. Co-occurrence of mycotoxins is possible as either a result of contamination with more than one fungus or the fact that several fungal species are able to produce more than one mycotoxin.
The absence of Aflatoxin B1, B2, G1, G2, Ochratoxin A, T2-toxin and HT-2 toxin in the commercial maize samples over the past six seasons were confirmed in the 2016/2017 season. The fact that Aflatoxin B1, a mycotoxin classified as a cancer-causing hazard, does not occur in commercial maize produced in South Africa (except for three white maize samples in the 2014/2015 production season), is a huge food and feed safety advantage for the maize producers in South Africa.
Zearalenone (ZON) was detected in only 1% of the yellow maize samples and in 13% of the white maize samples, the highest value detected, namely 399 ug/kg was in a white maize sample. Zearalenone in white maize was found in five of the seven provinces from which samples were received. Zearalenone in yellow maize was found in North West Province and Mpumalanga. It must be noted that Zearalenone was not found in any of the maize samples from the Limpopo regions over the past seven seasons.
The most predominant mycotoxins observed in seven seasons in most regions on both white and yellow maize are Fumonisins B1, B2, B3 and Deoxynivalenol. With the amendment of South African Regulations in 2016 to include maximum allowable levels for Fumonisins and Deoxynivalenol for human consumption, it is important to focus on the percentage samples with concentrations just below and above the maximum allowable levels in unprocessed maize, namely 4 000 µg/kg Fumonisins B1 + B2 and 2 000 µg/kg Deoxynivalenol.
The percentage samples with Deoxynivalenol at different concentration levels in the 2016/2017 season, is summarised for all maize (white and yellow maize), white maize only and yellow maize only, in Graph 1 to Graph 3. Although Deoxynivalenol was not detected in 63% of the maize samples, only 46,4% of white maize samples contained no Deoxynivalenol.
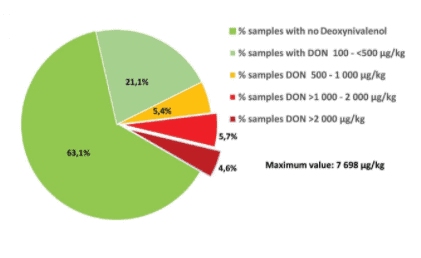
Graph 1: Deoxynivalenol occurrence in the 2016/2017 maize crop.
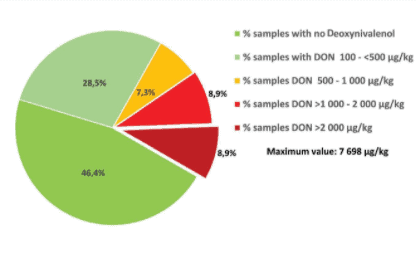
Graph 2: Deoxynivalenol occurrence in the 2016/2017 white maize crop.
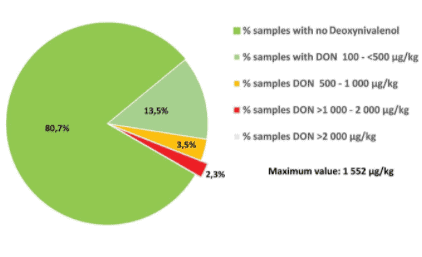
Graph 3: Deoxynivalenol occurrence in the 2016/2017 yellow maize crop.
It should also be noted that in 8,9% of white maize samples and 2,3% of yellow maize samples, Deoxynivalenol concentrations above the regulated maximum allowable level of 2 000 µg/kg were measured, with 7 698 µg/kg the highest concentration observed on one white maize sample.
The number of samples that contained Deoxynivalenol increased with 14% this season, from 23% in 2015/2016 to 37% in 2016/2017. The highest increase in percentage samples containing Deoxynivalenol was observed in the white maize samples; from 26% in the previous season to 54% of the samples this season. In five of the provinces, the mean Deoxynivalenol values of the white maize were higher than the yellow maize mean values.
Fewer samples contained Fumonisins this past season, with occurrences decreasing from 57% previously to 44% of the samples. Graph 4 to Graph 6 are summaries of the percentage samples with different Fumonisin concentration levels in the 2016/2017 season for all maize, white maize and yellow maize. None of the white maize samples contained Fumonisins above 4 000 µg/kg. Values exceeding 4 000 µg/kg were measured in 1,2% of the yellow maize samples, with one yellow maize sample reporting 6 059 µg/kg Fumonisins. The white maize and yellow maize Fumonisins mean concentrations are similar in most provinces.
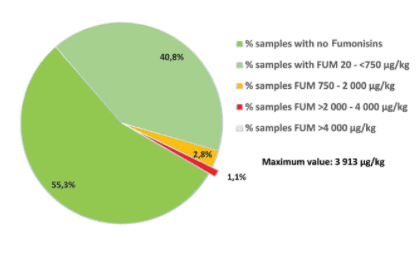
Graph 4: Fumonisin occurrence in the 2016/2017 maize crop.
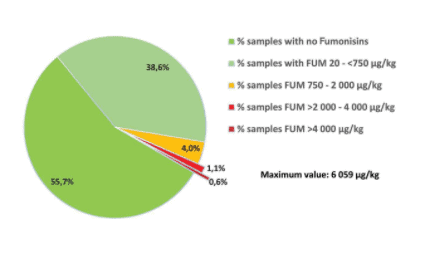
Graph 5: Fumonisin occurrence in the 2016/2017 white maize crop.
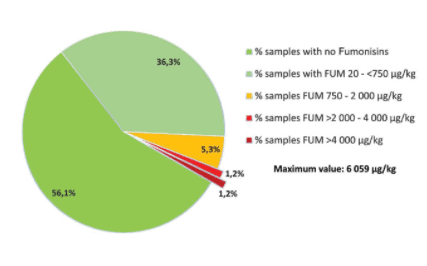
Graph 6: Fumonisin occurrence in the 2016/2017 yellow maize crop.
The different trends observed on the mean concentrations of Fumonisins, Deoxynivalenol and Zearalenone over the past seven seasons in the different regions, confirmed again the well-known fact that the mycotoxin risk in maize produced, differ from season to season in the same region and also from region to region. This can be ascribed to the fact that the occurrence and concentration levels of mycotoxins are related to environmental factors as well as seasonal climatic conditions during the pre-harvest production period.
Crop overview
The all-time high record crop of the 2016/2017 season was more than double that of the severe drought affected 2015/2016 season and 51,6% higher than the previous ten-year crop average (11 096 476 tons). White maize’s contribution to the total production was 9 916 000 tons (59%) and that of yellow maize 6 904 000 tons (41%).
The total area utilised for maize production in the 2016/2017 season was 2 628 600 ha, an increase of 35% compared to the previous season and 2,4% higher than the previous ten-year average. White maize was planted on 1 643 100 ha and yellow maize on 985 500 ha (1 014 750 and 932 000 ha respectively in the 2015/2016 season).
Maize yield also reached an all-time high of 6,40 t/ha this season compared to the 4 t/ha in the previous season and a 4,31 t/ha ten-year average. White maize yielded 6,03 t/ha and yellow maize 7,01 t/ha.
Due to the record local crop no maize where imported during the period May 2017 to April 2018.
Grading
1 000 composite maize crop samples, representing individual silo bins and bunkers, were received this season. The maize crop was of very good quality, with 85% of white and 92% of yellow maize, graded as maize grade one, compared to the 72% and 78% of the 2015/2016 season. The percentage total defective kernels above and below the 6,35 mm sieve, 4,7% for white and 4,4% for yellow maize was 1,5% and 1,3% respectively lower than the previous season.
The percentages Diplodia, as well as Fusarium infected kernels on both white and yellow maize, were between 0,2% and 0,4% lower than in the previous season.
Foreign matter did not pose significant problems, with seven white and three yellow maize samples downgraded to class other maize due to foreign matter exceeding 0,75%. Only one yellow maize sample was downgraded as a result of other colour maize that exceeded 5%. The average percentage combined deviations of white maize were 5,1% compared to the 6,7% of the 2015/2016 season, that of yellow maize was slightly lower, 4,7% compared to 6% previously.
Physical quality factors
Test weight is determined at most intake points locally. White maize had an average test weight of 77,7 kg/hl compared to the 76,9 kg/hl of yellow maize. White maize’s average test weight was 0,3 kg/hl lower than the previous season and that of yellow maize 0,2 kg/hl higher. The test weight in total varied from 67,6 kg/hl to 82,4 kg/hl.
The 100 kernel mass (‘as is’ basis) of white maize (35 g) averaged higher than yellow maize (33,5 g). This trend was also observed in previous seasons. The percentage yellow maize kernels above the 10 mm sieve were on average 10,7% lower than white kernels and the percentage yellow kernels below the 8 mm sieve 9,3% higher than that of white maize. White maize kernels were larger than in the previous two seasons, while the yellow maize kernels were still some of the smallest over the past ten seasons.
Both white and yellow maize were slightly more susceptible to breakage than during the previous season. The percentage of stress cracks observed varied overall from 0% to 50% and averaged 8% for both white and yellow maize – 3% higher than in the previous season.
Milling Index
Milling Index is an indication of the milling abilities and milling quality of maize kernels, where a higher Milling Index means a higher extraction of the high-grade and most profitable products like samp, maize rice and maize grits (degermed products) that are manufactured from the corneous part of the endosperm.
The Milling Index is a model developed on the Foss NIT Infratec 1241- Generation 3 Standard Version Grain Analyser where the NIT spectra were modelled against the Roff milling fractions. In the previous seasons (until 2015/2016) the Milling Index of the samples were determined with the calibration model developed by the ARC-Grain Crops. With this model, the average Milling Index of a sample with good milling characteristics is about 95 with a variation of about 55 (low milling quality) to about 115 (very good milling quality).
The SAGL was tasked by the Maize Trust to develop a new model for Milling Index using samples from maize cultivar trials supplied by the ARC-Grain Crops and by commercial seed breeders over four seasons (from 2012/2013 onward). The trials included a range of hardness levels. The New Milling Index (NMI) that was developed is similar to the original ARC formula but on a 14% moisture basis, and with the constants removed. The NMI model has improved precision compared to the older version, due to the almost tenfold increase in the number of samples used to build the calibration model.
During the fifth year, samples of commercial hybrids, selected imported maize samples and outlier samples from the 2014/2015 and 2015/2016 seasons were included to develop a robust model with the assistance of FOSS to produce accurate results. The improved new model, SAGL Milling Index 2017, now includes two parameters, SAGL Milling Index (SAGL MI) as well as a new parameter namely Grit Yield All (GYA).
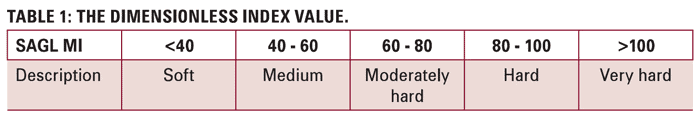
SAGL Milling Index indicates the relative ratio of total hard endosperm products (B2 grits, B3 fine grits and B3 coarse grits) to offal products (B1 fine flour and total chop/bran) as determined on a Roff mill and used for calibration of the NIT. It is expressed as a dimensionless index value according to the scale in Table 1.
Grit Yield All is defined as the sum of the mass fractions of the Roff B2 grits, B3 fine grits and B3 coarse grits fractions expressed as a mass percentage of the total mass of the whole maize before milling. Grit Yield All is linearly correlated with the SAGL MI and indicates the true amount of total hard endosperm that can be extracted from the maize during Roff milling. The NIT calibration value for Grit Yield All provides this estimate directly from the whole maize without need for further milling tests. Grit Yield All is also reported on a 14% moisture base.
The 2016/2017 season maize samples were measured with the NIT on the SAGL Milling Index 2017 model. The Milling Index varied from an average of 80,2 for white maize to 76,8 for yellow maize. Grit Yield All values averaged 64,8 for white maize and 64 for yellow maize.
Roff milling and whiteness index
The average percentage extraction of total meal in white maize obtained with the Roff mill averaged 78,6% (0,2% higher than the previous season) and varied from 69,7% to 81,7%.
For unsifted and sifted maize meal the whiteness index averaged 25,4 and 17,4 respectively. Sieving the sample eliminates differences in the readings as a result of particle size. The whiteness index of the previous season averaged 26,1 and 17,5 for unsifted and sifted maize meal respectively.
The higher the whiteness index (WI) value obtained, the whiter the meal sample. The sample with the lowest sifted whiteness index value of -17,5 this season, also had the highest percentage other colour maize namely 7%.
Nutritional values
The average fat content of white maize was 0,1% higher than the 4,1% of both the previous season as well as the average fat content of yellow maize this season. The protein content of yellow maize averaged 8,9%, which was 0,2% higher than that of white maize. The protein content of yellow maize was on average 0,8% lower than in the previous season and that of white maize 1% lower than in the 2015/2016 season. The protein contents, however, compare very well with the ten-year averages.
Starch content of white maize (74,1%) was on average 1,5% higher than in the previous season and yellow maize (73,7%) 1,4% higher. Both are also higher than the ten-year averages. The fat, starch and protein nutritional components are reported as a percentage (g/100 g) on a dry base.
Visit our website (www.sagl.co.za) for detailed results of this, as well as previous surveys. The reports are also available for download in a PDF format.
