Wheat contributed 79% to the total winter cereal crop production in South Africa during the 2017/2018 production season. The Southern African Grain Laboratory (SAGL) received and analysed 304 samples to provide as best possible a proportional representation of the production of wheat in all the different production regions. See Graph 1 for the percentage of samples graded per class and grade during this season.
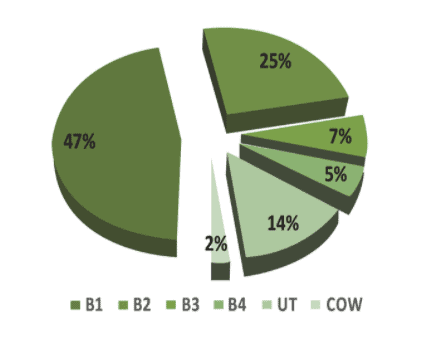
Graph 1: Percentage of samples per class and grade in the 2017/2018 season.
The majority of the samples (71%) downgraded to utility-grade was as a result of either the percentage screenings or mainly other grain and unthreshed ears, individually, or in combination with the combined deviations, exceeding the maximum allowable level for grades B1 to B4. Most of these downgraded samples originated from the Western Cape.
Grade B1 wheat in the Free State amounted to 51% (71% in the previous season). In the irrigation areas, 43% (52% in the previous season) of the wheat was graded as B1 and in the Western Cape, 48% was graded as B1 (22% in the previous season).
The national whole wheat protein average increased from 12% in the previous season to 12,6%. The ten-year national average is 11,9%. This is the second-highest average since the 2004/2005 season and can be attributed to the above-average protein values observed in the winter rainfall area of the Western Cape where severe drought conditions were experienced.
The winter rainfall area reported its highest protein average of 13,2% since the start of this annual survey 20 years ago. The irrigation areas averaged 11,9% and the production regions in the Free State 12,6%. The percentage of samples having protein contents higher than 12% increased from 47,8% last season to 63,5%. During the 2015/2016 season, this percentage was 68,2%. The protein content is reported on a 12% moisture basis.
Nationally the average hectolitre mass was 80,7 kg/hl, slightly lower than the 81,5 kg/hl of the 2016/2017 season. This value also compares very well with the eight-year weighted average of 80,6 kg/hl for determinations done by means of the Kern 222 instrument.
Of the 31 samples that reported values below the 77 kg/hl minimum level for grade B1 wheat, 26 originated in the Western Cape (as can be expected due to the drought), while the remaining five samples originated in the Free State production regions. The regional averages ranged from 79,1 kg/hl in the Western Cape to 83,2 kg/hl in the irrigation areas.
The 1 000 kernel mass, reported on a 13% moisture basis, decreased from 38,6 g last season to 37,7 g this season. The 2015/2016 season’s average was 36,8 g. Averages over production areas varied from 36,2 g in the Western Cape to 39,6 g in the irrigation areas.
The weighted average percentage screenings obtained with a 1,8 mm slotted sieve was 1,51%, 0,35% lower than the previous season and also the lowest value in the past five seasons. The winter rainfall area reported the highest average percentage, namely 1,79% and the irrigation areas the lowest of 1,05%. 28 of the 304 samples exceeded the 3% maximum permissible screenings level for grade B3 and of these eleven exceeded the 4% maximum permissible level for grade B4. Most of these samples originated in the Western Cape.
This season the average falling number was 371 sec. Five of the samples analysed gave falling number values below 250 sec and of these, four were below 220 sec. All but one of these samples originated in the Free State area, the other sample in the Western Cape. The highest average falling number value of 385 sec, was reported for the irrigation areas. The results of this, as well as previous surveys, provide evidence that low falling number values are generally not a problem experienced in South Africa.
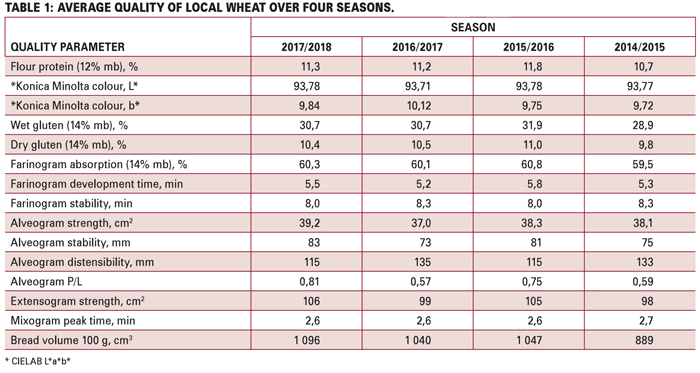
See Table 1 for a comparison of the average quality results of local wheat over the past four seasons. It is interesting to note that the average values of the 2017/2018 and 2015/2016 seasons’ farinograph, alveograph and extensograph results are almost identical, while the 2016/2017 and 2014/2015 results are very similar. A decrease in the alveogram distensibility with a resulting increase in the P/L value is indicative of a more elastic dough. The P/L value is obtained by dividing the stability value (P) by the distensibility value (L).
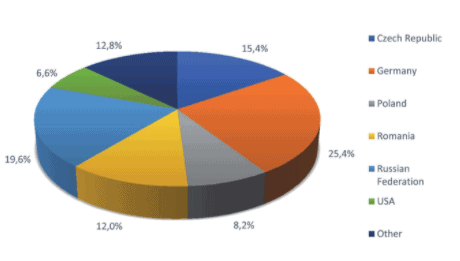
Graph 2: Wheat imports per origin for domestic use 2016/2017 season.
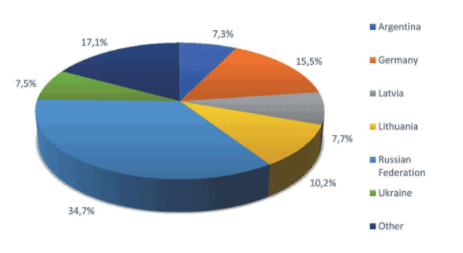
Graph 3: Wheat imports per origin for domestic use 2017/2018 season.
*Include imports up to 10 August 2018
Mycotoxins
Mycotoxins, toxic chemical compounds produced by moulds, can contaminate commodities either in the field or during storage and are invisible, odourless and tasteless. Mycotoxin production is foremost a food safety issue, although the occurrence of moulds can also lead to damage ranging from rancidity, odour, flavour changes, loss of nutrients and germ layer destruction resulting in a reduction in quality. Most mycotoxins are toxic in very low concentrations so this requires sensitive and reliable methods for their detection.
According to the Food and Agriculture Organization, food losses due to mycotoxin contamination are estimated at 25% on a global scale and pose a real threat to food security, especially in Africa where the magnitude of losses is difficult to estimate because of a lack of information. Effective management to prevent food losses or adverse health effects as a result of long-term exposure to contaminated food is only possible when adequate reliable testing data is available. Well-timed interventions in the food and feed value chain can then be based on these testing results.
The accredited multi-mycotoxin assessments included in the annual wheat crop quality survey for the past eight seasons, provide the most comprehensive overview of the multi-mycotoxin risk in commercial wheat produced and delivered to commercial grain storage companies in South Africa. 40 wheat samples, randomly selected to represent different regions as well as grades, are analysed annually.
An absence of Aflatoxin B1, B2, G1, G2, Fumonisin B1, B2, B3, Ochratoxin A, Zearalenone, T2-toxin and HT-2 toxin in the wheat samples over the past seven seasons were confirmed in the 2017/2018 season. The samples that did test positive for Deoxynivalenol (DON) residues this season, were all well below national and international maximum residue levels, as was the case in previous seasons. The average value of the seven positive results was 202 µg/kg (ppb) and the highest value obtained 570 µg/kg. Last season, four samples tested positive for DON residues with an average value of 289 µg/kg (ppb), the highest value obtained was 501 µg/kg.
Constant monitoring and continued research on the prevention and mitigation of mycotoxin contamination are necessary. Application of good agricultural practices and storage conditions, as well as effective mycotoxin risk management programmes, are essential elements in preventing the negative effects of mycotoxins.
Production overview
The commercial wheat crop of the 2017/2018 season was set at 1,535 million tons, which is 375 000 tons (19,6%) lower than the previous season’s crop and also 16% lower than the ten-year production average of 1 826 800 tons (2007/2008 to 2016/2017 seasons). A total area of 491 600 ha was utilised for wheat production and the average yield was 3,12 t/ha.
A severely drought-stricken Western Cape produced 586 800 tons of wheat this season, contributing 38,2% of the total crop, compared to the 57,5% of the previous season. The Free State’s wheat production (336 000 tons) was the highest of the past five seasons. This figure was also the second-highest nationally. The irrigation areas of the Northern Cape, the third-largest wheat-producing area this season, produced 311 650 tons, 45 650 tons more than last season. The remainder of the wheat was produced mainly in Limpopo with 132 000 tons, representing an increase of 27% compared to the 2016/2017 season and North West Province, where production increased by 20% to 83 700 tons.
The area utilised for wheat production decreased by 3,3% to 491 600 ha from 508 365 ha in the previous season. The almost 51% decline in dryland area planted in the Free State, were off-set by a 56% increase in irrigation area planted and a 35% total yield increase. Nationally, dry land area decreased by 9,7% year on year and irrigation area increased by close to 22% year on year.
In the main production areas, the yield ranged from 1,80 t/ha in the winter rainfall area of the Western Cape to 4,20 t/ha in the Free State (summer rainfall and irrigation) to 8,20 t/ha for irrigation wheat produced in the Northern Cape. The national yield average decreased from 3,76 t/ha in the previous season to 3,12 t/ha. The drought in the Western Cape was the main contributor to this decrease in yield. (Figures obtained from the Crop Estimates Committee [CEC]).
Imported wheat
South Africa is a net importer of wheat and relies on imports to supply local demand. Demand for wheat processing (human, animal and gristing) was fairly stable over the past four seasons, varying 63 116 tons between the highest and lowest.
During the 2016/2017 season 934 765 tons of wheat were imported for local use. This figure constitutes an almost 55% decrease compared to the severe drought-stricken 2015/2016 season. A quarter (237 508 tons) of the total amount of wheat imported during the 2016/2017 season, originated in Germany, followed by 182 993 tons from the Russian Federation and 144 402 tons from the Czech Republic.
A total number of 93 samples of wheat imported from eleven countries were received for analysis. Wheat imported for purposes other than bread baking (e.g. soft types for biscuit making) is included.
18% of the samples had hectolitre mass values below 77 kg/hl, compared to the 7% and 3% of the previous two seasons. These samples originated from the Russian Federation, Poland and Ukraine, which reported the lowest hectolitre mass values overall. None of the imported samples reported falling number results below 220 sec. As in the previous three seasons, the wheat imported from Australia had the highest falling number value.
The imported Canadian wheat again had the highest protein content resulting in the highest gluten content. In general, the imported wheat had lower farinograph water absorption values and shorter development times than local wheat. Alveograph strengths tended to be lower and the distensibility values shorter. Most of these samples again showed a tendency towards longer mixogram mixing times.
Composite samples of holds per shipment per country were tested for the presence of mycotoxin residues by means of a multi-mycotoxin analysis. The mycotoxin results did not raise any concerns. Deoxynivalenol (DON) residues were observed on some of the samples, but none of the levels exceeded national or international maximum residue levels.
The amount of wheat imported for local consumption so far during the current season (up to 10 August 2018), amounts to 1 815 759 tons according to SAGIS. Almost 35% of this wheat originated in the Russian Federation. The analysis of 151 samples have been completed to date. Similar quality and mycotoxin trends as mentioned above for the 2016/2017 season, are observed on these imported wheat samples.
Visit our website, www.sagl.co.za, for detailed results on local as well as imported wheat quality surveys. The crop quality reports can also be downloaded in PDF format.
