Local and Imported Wheat Quality Reviewed
Wheat samples of the 2019/2020 season were the first crop survey to be graded according to the latest bread wheat grading regulations published in the Government Gazette No. 42862, dated 29 November 2019.
These regulations are detailed in Government Notice No. R. 1547 of 29 November 2019. Producers now have the advantage of a Super Grade (BS) requiring a minimum protein content of 12,5% (12% moisture basis) and a minimum hectolitre mass of 76 kg/hl. Grade 4 and Utility Grade wheat are no longer provided for in these grading regulations.
The 333 representative crop samples were graded as follows: 40% was graded as BS, 17% was graded as Grade 1 (B1), 7% was graded as Grade 2 (B2), 4% was graded as Grade 3 (B3) and 32% as Class Other Wheat (COW) (Graph 1 and Graph 2). The majority of the samples (59%) downgraded to COW was as a result of the percentage screenings exceeding the maximum allowable level (3%) for BS to B3. The percentages of other grain and unthreshed ears and total damaged kernels (mainly sprouted kernels) in combination with the combined deviations also caused a number of downgrades, as did the falling number and hectolitre mass. 42% of the downgraded samples originated from the Western Cape, 30% from the Free State and 28% from the irrigation areas.
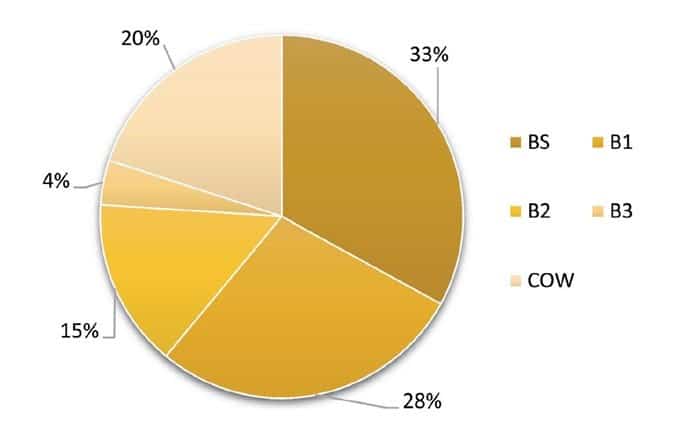
Graph 1: Percentage of samples per class and grade in the 2018/2019 season according to the current grading regulations.
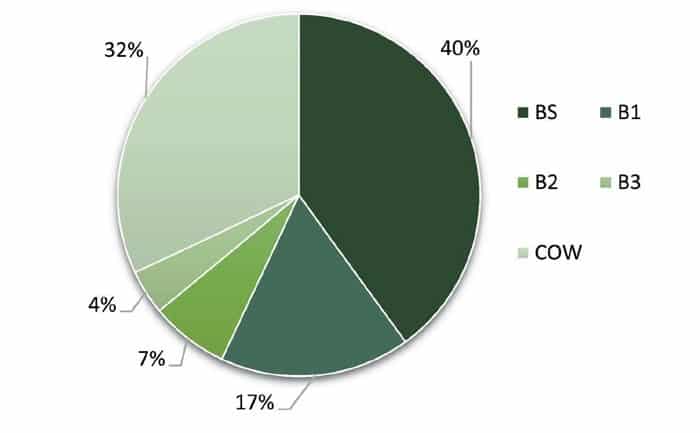
Graph 2: Percentage of samples per class and grade in the 2019/2020 season.
39% of wheat samples originating in the Free State were graded as BS. 41% of the wheat samples from the irrigation areas and 38% of wheat samples from the Western Cape were graded as BS.
In addition to the grading analysis, visual cultivar identification was done and the thousand kernel mass determined on each of the individual samples. Sub-samples were milled on a Quadromat Junior mill for mixograph analyses. Composite samples per class and grade for each production region were milled on a Bühler MLU 202 laboratory mill. Moisture, protein, ash and colour determinations were done and Rapid Visco Analyser (RVA) analyses conducted. Rheological (dough quality) analyses, namely gluten, mixogram, farinogram, alveogram, extensogram and 100-gram baking tests, were then performed. Multi-mycotoxin analyses were performed on 40 samples randomly selected to represent the different production regions. The amino acid profiles of a selection of samples were also determined.
Quality results
The hectolitre mass averaged 78,9 kg/hl and decreased by 2,4 kg/hl compared to the previous season. This was also the lowest average since the 2010/2011 season when the use of an instrument that complies with ISO standard 7971-3 (for example Kern 222) became compulsory. The ten-year national average is 80,5 kg/hl (Graph 3). 55 samples (16,5%) reported values below the minimum requirement of 76 kg/hl for BS, B1 and B2. Of these, 33 samples originated in the Western Cape (winter rainfall area), nine in North West, twelve in the Free State and one in Gauteng. Regional averages ranged from 77,2 kg/hl in the Western Cape and 77,4 kg/hl in the Free State to 80,7 kg/hl in the irrigation areas.
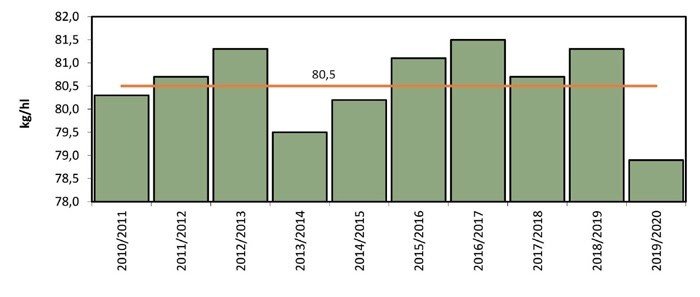
Graph 3: Weighted average hectolitre mass over ten seasons.
The national weighted average falling number this season was 353 seconds. This average was lower than last season’s 397 seconds as well as the ten-year weighted average value of 369 seconds. 32 (9,6%) of the samples analysed gave falling number values below 250 seconds and of these 28 were below 220 seconds and subsequently downgraded to COW.
These downgraded samples originated from North West (13), the Free State (13) and Gauteng (2). The previous season only one sample was downgraded to COW due to a low falling number. The highest regional average falling number value of 367 seconds was reported for the Western Cape and the lowest, namely 308 seconds, for the Free State. All falling number values reported are corrected for the altitude at which the test is performed.
Graph 4 shows the protein content distribution over the last three seasons. The national whole wheat protein average increased from 12,1% in the previous season to 12,9%. The ten-year national average is 12,1%. The percentage of samples from this crop survey with a protein content equal to or higher than 12,5% (minimum protein content for BS) was 64,2%.
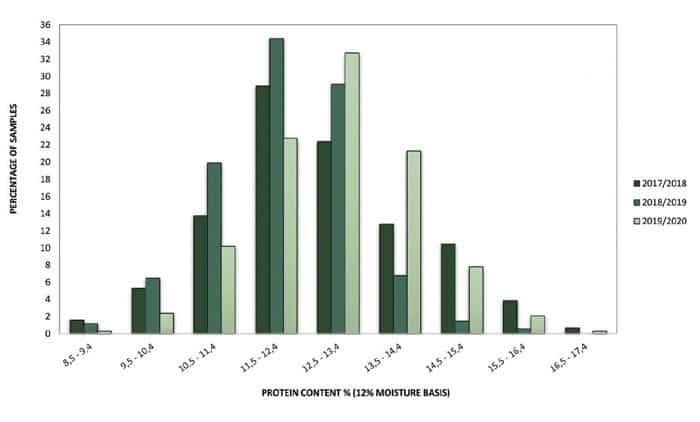
Graph 4: Protein content distribution over the last three seasons.
The summer rainfall and irrigation areas of the Free State reported the highest whole wheat protein average, namely 13,7%. The production regions in the winter rainfall area of the Western Cape averaged 12,8% and the irrigation areas 12,6%.
Flour protein content is on average 0,5% to 1,2% lower than that of whole wheat and averaged 11,9% this season, one percent higher than the previous season. The protein content is reported on a 12% moisture basis. The decrease in hectolitre mass values and the increase in protein content observed can be attributed to the drought conditions experienced over large parts of the wheat production regions.
The 1 000 kernel mass, reported on a 13% moisture basis, decreased from 39,2 g last season to 35,6 g this season. The 2017/2018 season’s average was 37,7 g. Averages over production areas varied from 32,4 g in the Free State to 34,0 g in the winter rainfall areas and 38,2 g in the irrigation areas.
Weighted average percentage screenings obtained with a 1,8 mm slotted sieve was 1,92%, the highest of the past five seasons. The winter rainfall areas reported the highest average percentage, namely 2,39% and the irrigation areas the lowest of 1,36%. 62 (18,6%) of the 333 samples exceeded the 3% maximum permissible screenings level for BS to B3. Most (59,7%) of these samples originated in the Western Cape.
The weighted mixogram peak time on flour milled on the Quadromat Junior mill averaged 3,0 minutes compared to the 2,8 minutes of the previous season and slightly longer than the ten-year average of 2,9 minutes. The weighted mixogram peak time of the flour from the Bühler mill was 2,6 minutes, equal to the previous four seasons.
Composite samples per class and grade per production region were cleaned, conditioned and then milled to facilitate flour and dough quality assessment. The weighted average Bühler MLU 202 laboratory mill extraction for the composite samples was 74,8% compared to the 71,3% of the previous season.
Flour colour determinations were done by means of a Konica Minolta CM-5 spectrophotometer on the composite flour samples. The averages and ranges of the L*a*b* values correspond well with that of the previous seven seasons. The average ash content was 0,64% on a dry basis (moisture-free basis), compared to the 0,60% of the previous season.
A Rapid Visco Analyser (RVA) is a rotational viscometer, able to continuously record the viscosity of a sample (under controlled temperature conditions) during the gelatinisation and pasting processes as starch granules absorb water, swell and disintegrate, followed by a possible realignment of the starch molecules during cooling (retrogradation).
Maximum viscosity before the onset of cooling (peak viscosity), time to peak viscosity, minimum viscosity after the peak (trough) and final viscosity are measured and provide indications of the pasting properties of the samples and therefore its processing value for baking and other applications. The average peak viscosity of the samples analysed was 1 852 cP (centipoise), the minimum viscosity 1 407 cP and the final viscosity 2 049 cP. Last season the values were 2 218 cP, 1 675 cP and 2 516 cP respectively. The effect of sprout damage on the starch and gelatinisation properties of wheat samples were well illustrated this season.
The wet gluten (14% moisture basis) averaged 31,1% and the dry gluten averaged 10,6% (also on a 14% moisture basis). These values averaged 30,1% and 10,1% respectively in the previous season. The average gluten index value was 95 (94 last season), ranging between 79 and 99. The gluten index provides an indication of the gluten strength (higher being better) and is not influenced by the protein content as are the wet and dry gluten values.
Farinograph analysis resulted in average water absorption of 60,2% (60,5% the previous season) and average development time of 5,4 minutes (5,0 minutes the previous season). The stability value of 8,1 minutes was one minute longer than the previous average. The mixing tolerance index equalled that of the previous season, namely 41 BU.
The average alveogram strength was 42,6 cm² and the average P/L value 0,60 (34,6 cm² and 0,81 the previous season). The distensibility of the dough increased on average compared to the previous season, indicating a more elastic dough. The stability value of 79 mm was slightly lower than the 82 mm of the previous season.
Average extensogram strength was 112 cm² (92 cm² previous season), confirming the stronger dough strength trend observed with the Alveograph. The maximum height in Brabender Units were also higher than last season (383 BU in 2019/2020 and 350 BU in 2018/2019). The average extensibility value increased as well, 211 mm this season compared to 191 mm the previous season.
The 100 g loaves baked using the straight-dough optimised bread-making method, showed an excellent relationship between the protein content and the bread volume.
Amino acid profile results
Amino acid profile (composition) is an important feature in determining the nutritional value of wheat for human and animal diets. Amino acids are the building blocks of proteins and 18 of the approximately 22 amino acids commonly distributed among the proteins of all biological materials, can be found in cereal grain proteins.
Protein and amino acid composition of wheat vary as a result of crop varieties, application of fertilisers, irrigation practices, soil composition and climatic conditions.
Amino acid profiles were determined on a subset of 35 samples, randomly selected to represent different regions as well as grades. The values obtained for all amino acids on these samples were within the normal range reported for wheat in literature – deficient in certain essential amino acids, such as tryptophan, lysine, threonine, methionine and histidine, but high in glutamic acid and proline. The range per season per individual amino acid compared well over the four seasons for which data are available.
For detailed results on this and all other quality testing performed on the survey samples, please refer to the SAGL website at www.sagl.co.za. The reports are also available in an easy-to-page format.
Mycotoxin results
The only proven way to determine whether grain, cereals, feed or food are contaminated, is by analytical testing. Between 10% and 20% of wheat crop samples were selected over the past ten seasons to proportionally represent all the production regions. Accredited multi-mycotoxin assessments on these samples provide the most comprehensive overview of the multi-mycotoxin risk in commercial wheat produced and delivered to commercial grain storage companies in South Africa.
The absence of aflatoxin B1, B2, G1, G2, fumonisin B1, B2, B3, ochratoxin A, T-2 toxin and HT-2 toxin in these wheat samples over the ten seasons were confirmed in the 2019/2020 season.
Six of the 40 samples tested this season tested positive for deoxynivalenol (DON) residues. The average value of the six positive results was 300 µg/kg (ppb) and the highest value obtained 1 017 µg/kg, still well below the national maximum allowable level of 2 000 µg/kg for cereal grain intended for further processing. Further processing means any other treatment or processing method that has been proven to reduce levels of fungus-produced toxins in foodstuffs intended for human consumption. Last season five samples tested positive for DON residues with an average value of 217 µg/kg (ppb). The highest value obtained was 361 µg/kg.
Zearalenone (ZON) residues were detected on a wheat crop sample for the first time. A sample from the North West production region reported a value of 29 µg/kg ZON. There is no national maximum allowable level set for ZON residues. International maximum allowable levels for ZON range between 50 µg/kg for bread, 60 µg/kg for wheat and wheat flour to 100 µg/kg for unprocessed cereals other than maize.
Constant monitoring and continued research on the prevention and mitigation of mycotoxin contamination are vital.
Imported wheat
South Africa is a net importer of wheat and relies on imports to supply local demand. Wheat processing demand (human, animal and gristing) in 2018/2019 was the highest of the past 21 seasons (3 254 656 tons). Nine months into the 2019/2020 season, this figure stands at 2 559 663 tons, 79% of the previous season’s figure.
During the 2018/2019 season, 1 368 097 tons of wheat were imported. 55% of the wheat imported during the 2018/2019 season for local use originated in the Russian Federation (29%) and Germany (26%). A total number of 168 samples of wheat imported from the following ten countries were received (number of samples received in brackets): Argentina (9), Canada (18), Czech Republic (5), Germany (39), Latvia (2), Lithuania (22), Poland (2), the Russian Federation (43), Ukraine (8) and the USA (20). Wheat imported for purposes other than bread baking (for example soft types for biscuit making) is included in this data set.
Please note that these imported wheat samples were graded according to the previous version of the national wheat grading regulations (Government Notice No. R. 64 of 29 January 2016). 4% of the samples had hectolitre mass values below 77 kg/hl (minimum requirement for South African grade B1 wheat), compared to the 7% and 18% of the previous two seasons. These samples originated from Lithuania, the Russian Federation and the USA.
Screenings represent all material that passes through a standard sieve (1,8 mm), with 3% the maximum allowed for B1 to B3 according to South African grading regulations. When comparing screening results originating from different countries, it is important to keep in mind that sieve aperture size and shape, as well as sample preparation procedures, vary between countries. Samples from the Russian Federation, the USA and Poland reported the highest levels of screenings, which at least in part explains the low hectolitre mass values observed on some of these samples.
None of the samples reported falling number results below 220 seconds. The wheat imported from Latvia had the lowest average falling number (280 seconds) and that of the USA the highest (446 seconds), compared to the 397 seconds of the South African national average for the same season.
The protein content and rheological characteristics of the wheat imported from the USA varied from low and weak to average and fair. The average values are therefore not a true reflection of the overall imported USA wheat bread baking quality, since most of the wheat imported were most probably not intended for bread baking purposes.
As in the previous seasons, the imported Canadian wheat had the highest protein content, resulting in the highest gluten content and the best rheological dough quality. The general trend towards lower farinograph water absorption and shorter development time than the average South African wheat is again observed. The Alveograph results in general compared better to that of local wheat than during the previous import season.
Most of the imported wheat samples again showed a tendency towards longer mixogram mixing times (in excess of four minutes). Some of these long mixing times can be explained by low protein levels in the samples. Mixing time provides an indication of the amount of time required to mix a dough to optimum development – 2,8 minutes to 3,5 minutes are considered acceptable in South Africa.
Composite samples of holds per shipment per country were tested for the presence of mycotoxin residues by means of a multi-mycotoxin analysis. The mycotoxin residue levels detected on the composite samples did not raise any major concerns. Most samples tested negative for all of the mycotoxins analysed (aflatoxin B1, B2, G1, G2, fumonisin B1, B2, B3, deoxynivalenol, 15-ADON, HT-2 toxin, T-2 toxin, zearalenone and ochratoxin A). On the samples that did test positive for some of the mycotoxins, deoxynivalenol was the most prevalent. All of these positive results were well below the national maximum allowable level of 2 000 µg/kg for cereals intended for further processing.
Wheat imported for local consumption during the current marketing season (up to 7 August 2020) amounts to 1 587 813 tons. The majority of this wheat originated in Poland (33%), the Russian Federation (18%), Germany (17%) and Lithuania (13%).
The results of samples of wheat imported during the current season (from 28 September 2019 onward) are updated quarterly and available on the SAGL website. Supply and demand figures were obtained from the South African Grain Information Service (SAGIS).
With gratitude to the Winter Cereal Trust for financial support of the annual crop and import surveys, to Agbiz Grain Members for providing the crop samples as well as DALRRD inspectors at the harbours for providing representative samples of each shipment of imported wheat.