
The first and very crucial step in any crop survey is obtaining the samples that will provide information about the quality of the crop. Without the cooperation of the commercial grain silo owners, members of Agbiz Grain, who supply these samples to the Southern African Grain Laboratory (SAGL) without any cost, these surveys would not be possible.
Each delivery of soybeans at the various delivery points throughout the soybean production regions is sampled as per the regulations for grading purposes. After grading, the samples are placed in separate containers according to class and grade per silo bin/bag/bunker at each delivery point. After 80% of the expected harvest has been received, the content of each container is divided with a multi-slot divider in order to obtain a three-kilogram sample.
If there is more than one container per class and grade per bin/bag/bunker, the combined contents of the containers are mixed thoroughly, before dividing it with a multi-slot divider to obtain the required three-kilogram sample. The samples are marked clearly with the name of the depot, the bin/bag/bunker number(s) represented by each individual sample as well as the class and grade, and then forwarded to the SAGL. The samples received at the SAGL are selected to proportionally resemble as closely as possible the Crop Estimates Committee’s production estimate figures per province.
The reason why the samples are only forwarded after at least 80% of the crop has been received, is to ensure that the samples analysed are representative of the crop. If an unlimited number of samples could have been analysed, it would not have been necessary to wait. Samples could then have been taken, forwarded and analysed throughout the harvesting process. Results could have been available much sooner, since the waiting period to reach 80% of the crop could have been eliminated.
2018/2019 survey
All 150 samples selected for the 2018/2019 survey (samples harvested during the first quarter of 2019) were graded according to the regulations relating to the grading, packing and marking of soybeans intended for sale in the Republic of South Africa (Government Notice No. R.370 of 21 April 2017). 89% (134) of the samples were graded as Grade SB1 – during the previous two seasons, this figure was 87% and 88% respectively.
The main reasons for downgrading 16 samples to Class Other Soybeans (COSB) were the percentage other grain, the percentage soiled soybeans as well as the number of Datura spp. and Convolvulus spp. seeds exceeding the maximum permissible percentage or number according to the regulations. Please see Table 1 for the grading standards for soybeans.
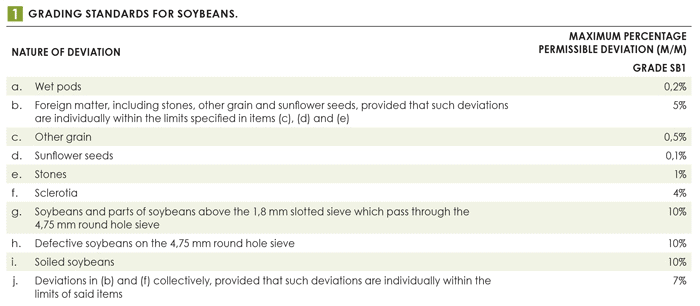
Other grains are defined as grains or pieces of grains of wheat, barley, oats, triticale, maize, rye and sorghum. Soiled soybeans means whole soybeans which do not pass through the 4,75 mm screen and are discoloured by soil or any other substances. However, if the discolouration is caused by plant material, the soybeans shall not be regarded as soiled soybeans.
The national weighted average percentage of soiled soybeans was 3,10%, compared to the 1,53% of the previous season. Six samples exceeded and one sample equalled the maximum permissible deviation of 10%. The highest percentage reported was 36%. All these samples originated in Mpumalanga. Last season, three samples exceeded this grading limit.
This season the percentage of samples containing sclerotia from the fungus Sclerotinia sclerotiorum decreased to 27% (41 samples) from 59% (88 samples) in the previous season. The five highest percentages sclerotia observed ranged from 0,44% (sample from Gauteng) to 0,24% (samples from Mpumalanga and the Free State). These percentages are, however, still well below the maximum permissible level. The national weighted average percentage this season was 0,03% compared to the 0,06% of the previous season.
The national weighted average percentage soybeans and parts of soybeans above the 1,8 mm slotted sieve which pass through the 4,75 mm round hole sieve, decreased from 1,54% the previous season to 1,13% this season. The weighted average percentage defective soybeans on the 4,75 mm sieve increased from 1,91% last season to 2,30% this season. Wet pods were not present in any of the samples.
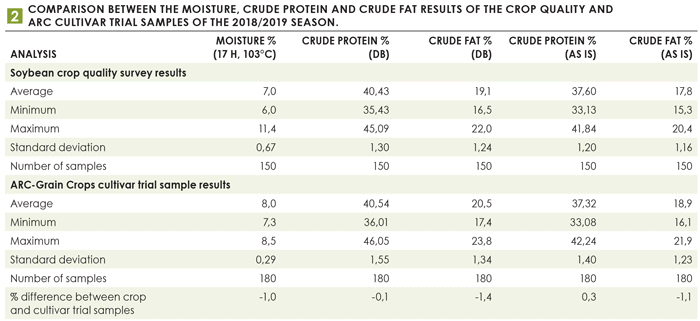
2018/2019 is the first season that the SAGL conducted the moisture, crude protein and crude fat analyses on the ARC-Grain Crops soybean cultivar trials’ samples. Please see a comparison of the results between the crop survey and cultivar trial samples in Table 2.
Crude fat, crude protein and crude fibre
This season’s crop samples’ weighted average crude protein content was 40,43% compared to the 40,18% of the previous season. As in the previous two seasons, Limpopo had the highest weighted average crude protein content (41,60%). The Free State (39,76%) and Gauteng (40,05%) again reported the lowest averages. The weighted average crude fat percentage of 19,1% was slightly lower than the 19,3% in the previous season and also the lowest of the last six seasons. The samples from KwaZulu-Natal had the highest weighted average crude fat content, namely 20,6%. The lowest average fat contents were observed in the Northern Cape and Free State provinces, both with 18,6%.
The weighted average percentage of crude fibre varied from 6,3% in KwaZulu-Natal to 7,5% in the Northern Cape. The national weighted average of 6,8% was the second-highest of the annual surveys since the 7,3% reported in the 2015/2016 season.
This season the average ash content was 4,67% – the highest of the eight seasons since the commencement of the crop surveys and 0,08% higher than the previous season. Samples from the Northern Cape and Limpopo, as well as North West to a lesser extent, tend to show higher ash contents over seasons compared to the other provinces. The nutritional component analyses are reported on a dry/moisture-free basis (db).
Fatty acid profile analyses
An exciting and important addition to the quality survey this season is the inclusion of fatty acid profile analyses. Fatty acid profiles are the most important tool for the identification of authenticity of vegetable fats and oils. All types of oil have their own specific fatty acid profile, which is unique to that product. The unique fatty acid profile of each product/crop is a combination of saturated, mono-unsaturated and poly-unsaturated oils and is specific to that type of oil.
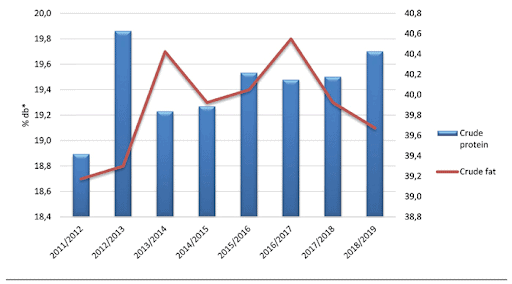
Graph 1: Crude protein and crude fat results of the soybean crop samples over the last eight seasons.
*dry/moisture-free basis
Fatty acid profiles of every crop, however, are subject to variation. The variation or typical pattern of fatty acids in a specific oil not only influences the stability and physical properties of the oil but also aids in distinguishing one type of oil from another. Variation of fatty acids within the same product depends on climate, latitude, soil type, cultivar, rainfall as well as seasonal variation. These variations should be included when ranges for identification of authenticity are determined.
It is imperative to include ranges wherein fatty acids vary, in order to successfully validate the authenticity of a specific vegetable oil. The building of a database requires the gathering of information over different seasons, areas and cultivars in order to give a true reflection of the ranges wherein fatty acids can differ. Currently, no national updated database for the fatty acid composition of soybean oil is available.
As a soybean-producing country, it is important that South Africa develops and maintains a national fatty acid profile database to the benefit of the oilseed industry. Annual analysis of crop and cultivar samples will ensure that the natural variation caused by different cultivars as well as the influence of climate and locality are included in the database values. Seasonal variations will also be addressed. Recording all variations applicable to the crops in the database will enable the annual review of the specified ranges.
Precision Oil Laboratories was subcontracted to perform fatty acid profile analyses on 20 composite crop samples representing different production regions as well as 21 cultivar samples from different localities supplied by the ARC-Grain Crops. A total of 20 different fatty acids were included in the profile analysis.
For more information on the results obtained for this survey, please refer to the 2018/2019 Soybean Crop Quality Report available on the SAGL website at www.sagl.co.za.
